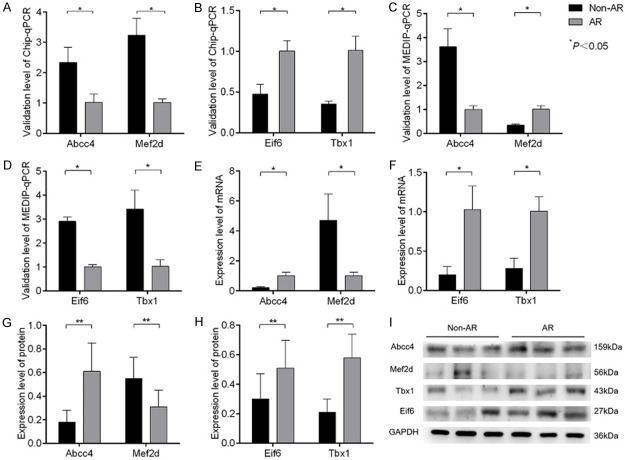
Figure 4.
mRNA and protein expressions of positive genes in CD4 +CD25 + Treg cells and DNA methylation levels. A, B: Verification by Chip-qPCR for the four positive genes. C, D: Verification by MEDIP-qPCR of the four positive genes. E, F: Verification of the mRNA expression of the four positive genes. G-I: Protein expression levels of four positive genes.

