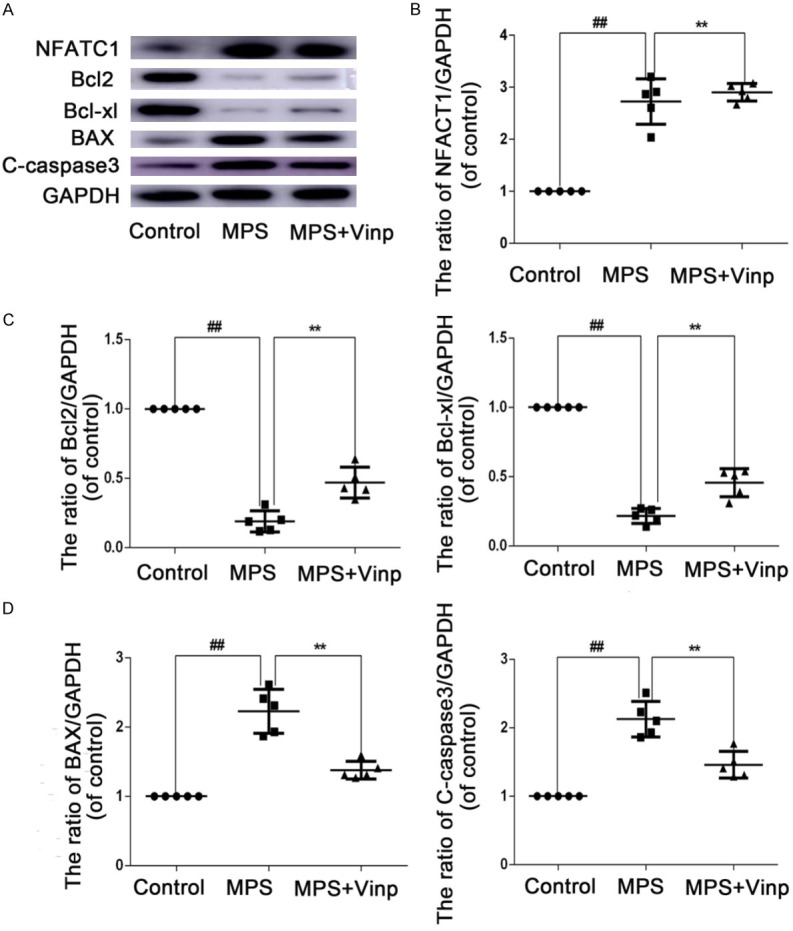
Figure 7.

The in vivo protective effect of Vinp against apoptosis. Protein expression was assessed by Western blot analysis (A) and quantification of the resulting bands (B-D). The data in the figures represent the averages ± S.D. Significant differences between the treatment and control groups are indicated as **P < 0.01. n = 3.
