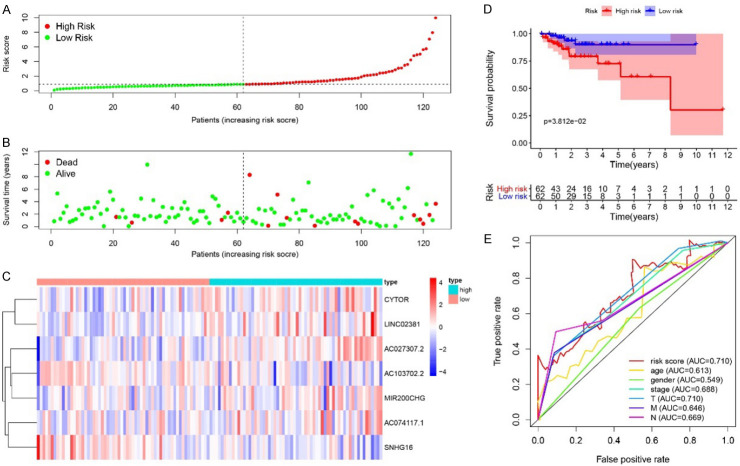
Figure 6.
Risk Score in Test cohort. A. The rank of calculated Risk Score. B. The survival status and survival time. C. Heatmap of expression of 7 lncRNAs. D. Kaplan-Meier survival curve of the patients in high-risk and low-risk groups. E. 5-year ROC curve of Risk Score, age, gender, stage, TNM. With the increased Risk Score, the mortality rate was increased. The KM survival curves of the high-risk and low-risk groups were significantly different. CYTOR, LINC02381, AC027307.2, MIR200CHG, AC074117.1 were up-regulated in the high-risk group, and SNHG16, AC103702.2 were down-regulated in the high-risk group. The 5-year ROC indicated an AUC of 0.710 for the Risk Score in risk prediction, which was better than that of age, gender, stage, and TNM.

