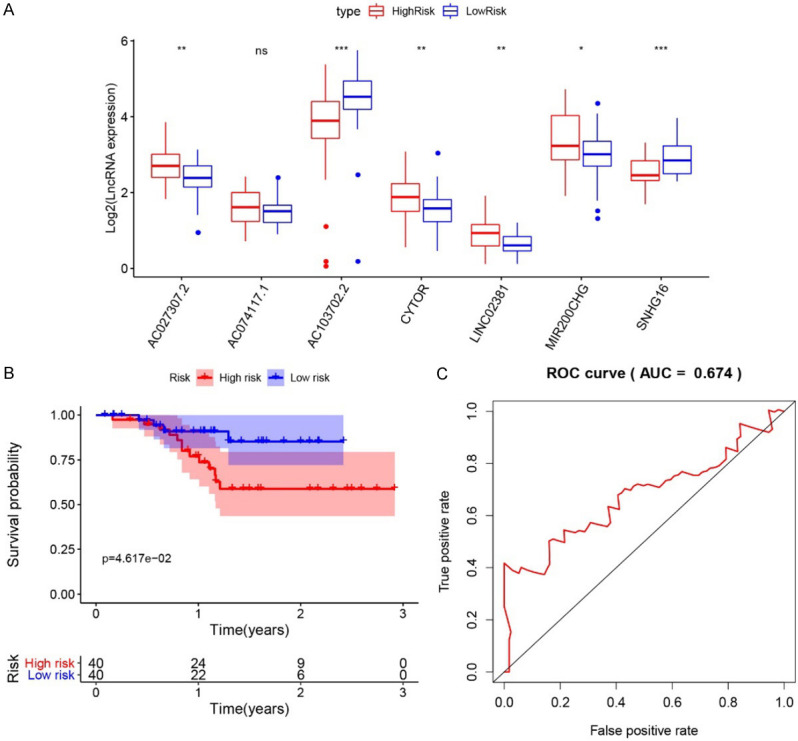
Figure 11.

A. The expression level of seven identified lncRNAs in tissues of high-risk and low-risk patients. Note: * indicated P < 0.05; ** indicated P < 0.01, and *** indicated P < 0.001; “ns” indicated not significant. B. Kaplan-Meier survival analysis of the low-risk and high-risk groups. C. 3-year ROC curve.
