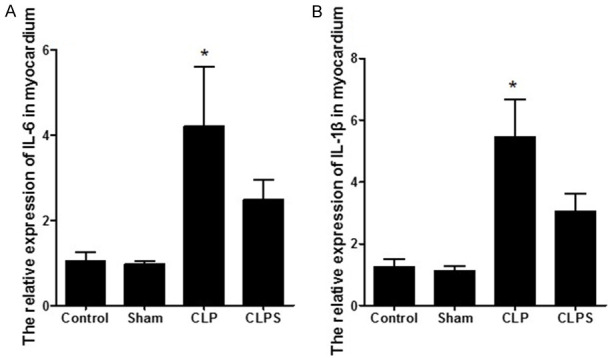
Figure 6.

The relative expression of IL-6 and IL-1β in myocardial tissue. A: Histogram showed the relative expression of IL-6 in four groups. Relative expression of IL-6 in myocardial tissue was higher than other three groups. B: Histogram showed the relative expression of IL-1β in four groups. Relative expression of IL-1β in myocardial tissue was higher than other three groups (n=5 for control and sham, n=10 for CLP and CLPS, *P<0.05 vs control, sham and CLPS).
