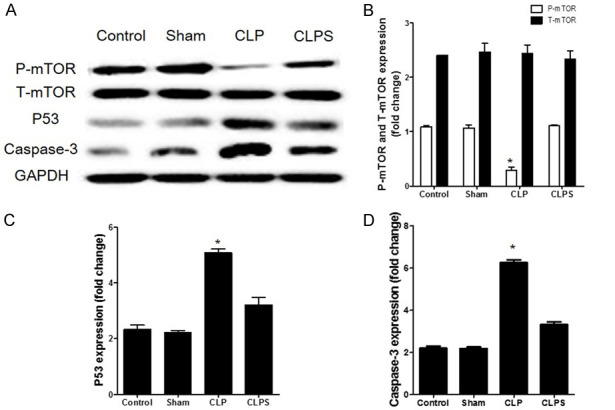
Figure 9.

The mTOR/P53 pathway in septic myocardial tissue. A: Representative Western blots normalized to GAPDH showed that in CLP group, the phosphorylation of mTOR was inhibited compared to control and sham. However, the phosphorylation of mTOR was higher in CLPS than CLP. Further, the expression of P53 and caspase-3 was down-regulated in CLPS compared to CLP. B: Densitometry quantitation of P-mTOR and T-mTOR expression levels are shown as fold changes in histogram. C: Densitometry quantitation of P53 expression levels are shown as fold changes in histogram. D: Densitometry quantitation of caspase-3 expression levels are shown as fold changes in histogram (n=5 for control and sham, n=10 for CLP and CLPS, *P<0.05 vs control, sham and CLPS).
