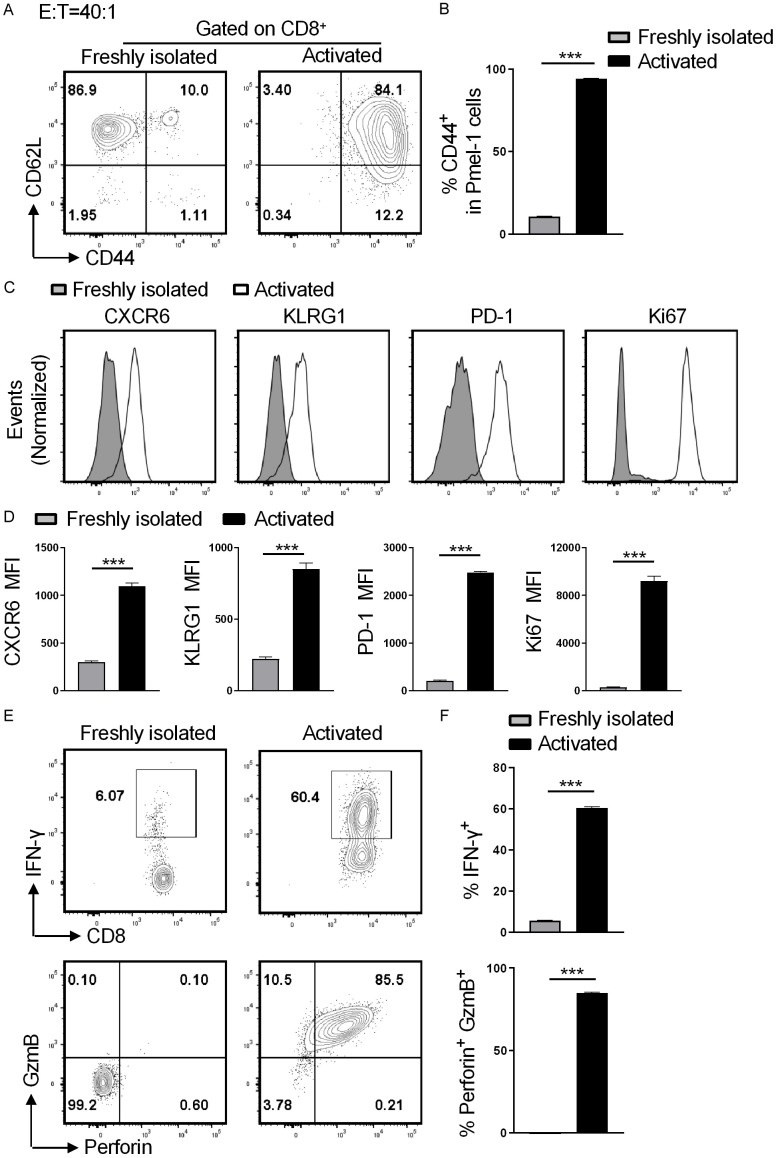
Figure 3.
Pmel-1 CD8+ displays an effector T cell phenotype during killing of B16F10 cells. The freshly isolated or the activated Pmel-1 splenocytes were co-cultured with B16F10 target cells at a CD8+ effector to target ration of 40:1 for 10 hours, followed by flow cytometry analysis. A. Representative plots of CD44 and CD62L expressions on CD8+ T cells. B. Quantitation of % CD44+ cells among Pmel-1 CD8+ cells. C. Histograms show CXCR6, KLRG1, PD-1 and Ki67 expressions on Pmel-1 CD8+ T cells. D. Bar graphs display mean fluorescence intensity (MFI) of CXCR6, KLRG1, PD-1 and Ki67 of Pmel-1 CD8+ T cells; E. Representative contour plots show % IFN-γ+ and % perforin+GzmB+ cells among Pmel-1 CD8+ T cells; F. Quantitation of % IFN-γ+ and % perforin+GzmB+ cells among CD8+ T cells. Data are presented by mean ± SD (n=5). ***P < 0.001; unpaired student’s t-test.

