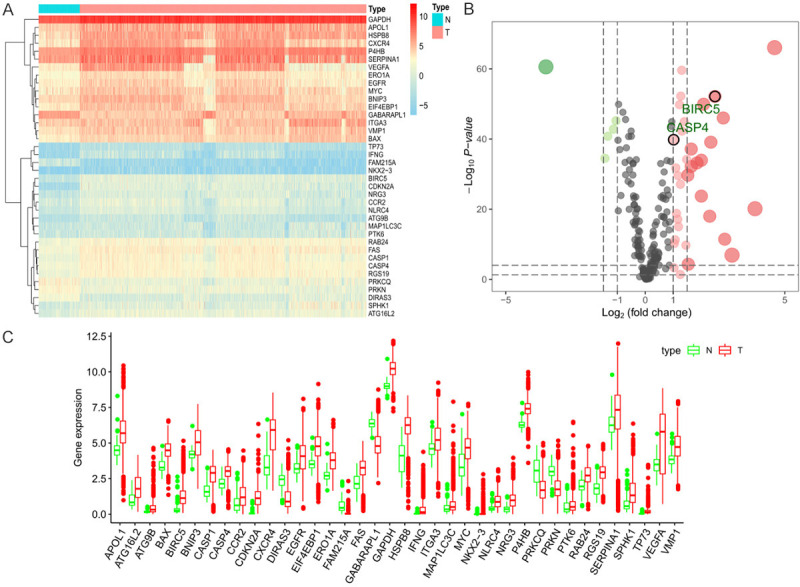
Figure 1.

Differences in autophagy-related gene (ARG) expression between renal cancer (RC) and normal tissues. A. Expression heatmap of differentially expressed ARGs in The Cancer Genome Atlas (TCGA) dataset. B. Volcano plots of the differentially expressed ARGs in TCGA dataset. Red and green nodes represent gene expression upregulation and downregulation, respectively. C. Visualization of 38 differentially expressed ARGs in the form of a box diagram.
