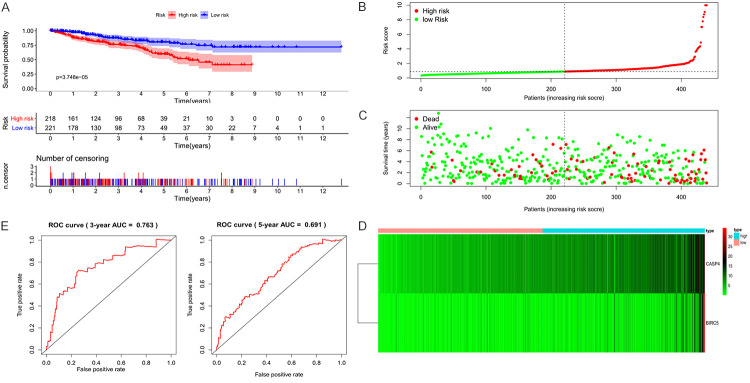
Figure 6.
Visualization of the prognostic model in test set patients. A. In the test set, high-risk patients were associated with significantly shorter overall survival. B. Distribution of risk values in test set patients. C. The survival status of test set patients with high and low risk values. D. Heatmap of expression profiles of two key genes in test set patients. E. Time-dependent receiver operating characteristic (ROC) curve analysis for survival prediction by the prognostic model based on the test set.

