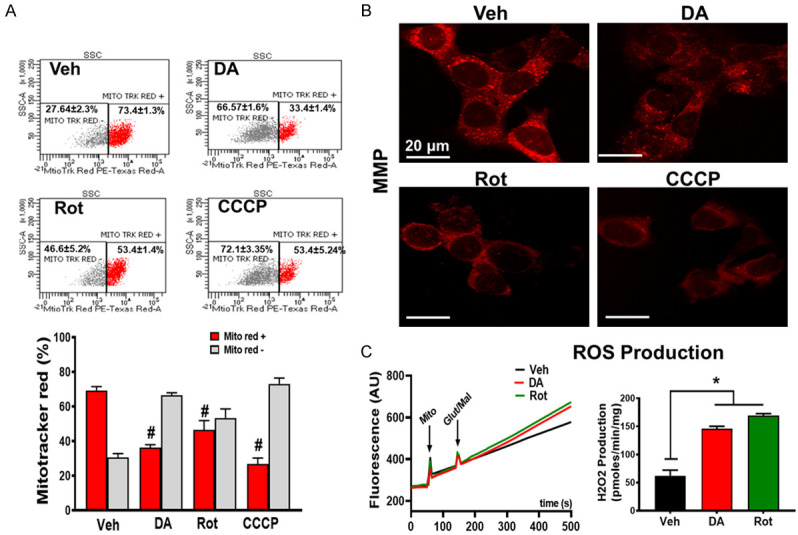
Figure 2.

PD stressors treatment causes mitochondrial dysfunction. A. Top: Mitochondrial membrane potential (ΔΨm) was measured by flow cytometry using MitoTracker Red. MitoTracker Red positive (red) and increase in MitoTracker Red negative (grey) cells treated with DA and Rot compared with vehicle. Bottom: corresponding graph showing the reduction in ΔΨm (Red bar: MitoTracker positive cells, grey bar: MitoTracker negative cells) in PD stressor treated cells. B. Fluorescent microscope images measured by MitoTracker Red. Representative images collected from N27-A cells treated with Vehicle, DA, Rot, or CCCP (positive control). Red color denotes MitoTracker Red staining. C. Left: Representative recording of mitochondria reactive oxygen species (ROS) production in PD stressor treated cells using Amplex red in the presence of horseradish peroxidase after stimulation of complex I with glutamate/malate. Right: Graph showing increase in ROS production in N27-A cells treated with DA and Rot compared with vehicle (Veh). Values are expressed as means ± SEM of three independent experiments, *P < 0.05 (n = 5/group).
