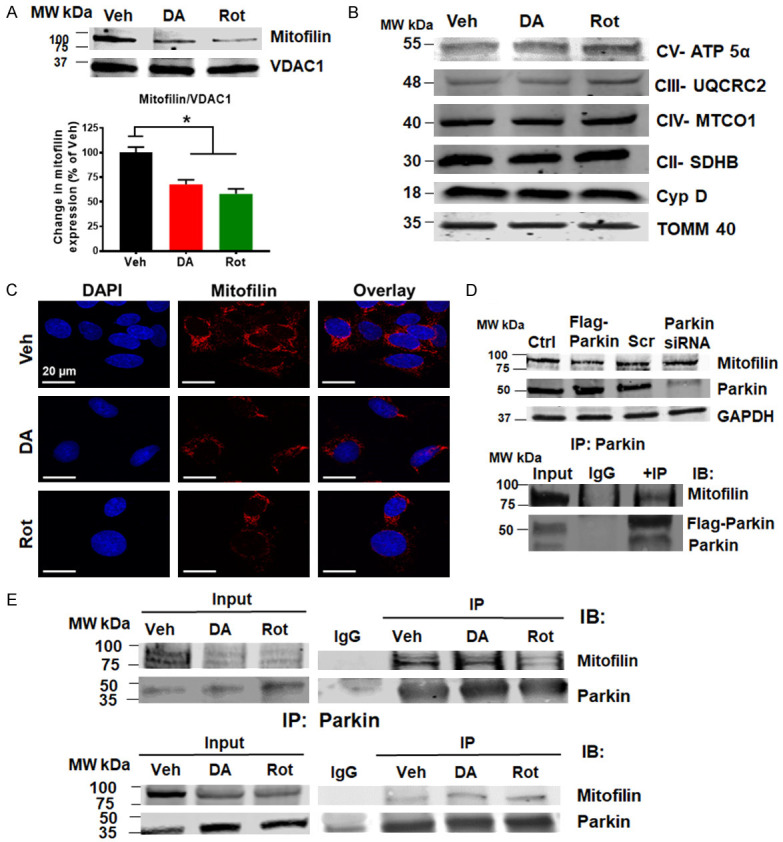
Figure 5.

PD stressors increases Parkin interaction with Mitofilin. A. Immunoblots and bar graph (as a percent of vehicle) showing a decrease in Mitofilin protein level after DA and Rot treatment compared with vehicle. B. Immunoblots showing no changes in various mitochondrial protein levels after DA, and Rot treatment compared with Veh. C. Confocal images showing immunolabeling of N27-A cells treated with Veh, DA, or Rot, and labeled with DAPI (blue), Mitofilin (red), and overlay. Note the reduction in Mitofilin intensity in DA and Rot treated cells. D. Top: Immunoblots showing Mitofilin reduction after Parkin overexpression and Mitofilin increase after Parkin knockdown. Cells were transfected with either PCMV6 entry plamid (control) or Flag-Parkin or scrambled (Scr) siRNA or Parkin siRNA. Bottom: Immunoblots of Co-IP showing Myc-Mitofilin interacting with Flag-Parkin in N27-A cells. Cells were co-transfected with Flag-Parkin and Myc-Mitofilin expression vectors for co-IP assays using the anti-Flag antibody. E. Immunoblots of Co-IP analysis using anti-Mitofilin antibody (top) and anti-Parkin antibody (bottom) showing increase in endogenous Parkin interaction with endogenous Mitofilin in N27A-cells in response DA and Rot treatments.
