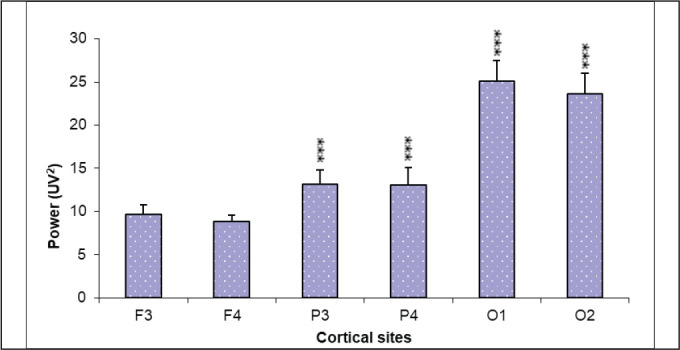
Figure 1. Resting Theta Power.

Legend: Figure depicts absolute power of theta activity in frontal (F3 and F4), parietal (P3 and P4), and occipital (O1 and O2) leads under resting conditions. Parietal and occipital areas showed significantly increased theta power as compared to their frontal power.
Source: Authors.
Note: Values are represented as mean ± SE (***p < .001).
