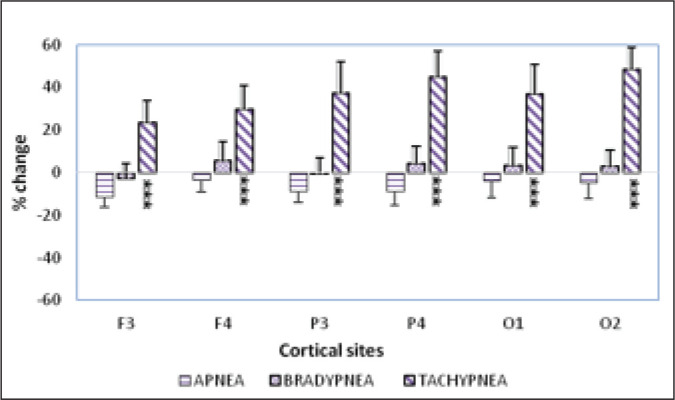
Figure 2. Postintervention Theta Power.

Legend: Spatial distribution of absolute power of theta activity in terms of % change from resting state following voluntary apnea, bradypnea, and tachypnea. Significantly increased theta activity was seen at all sites as compared to resting state following voluntary tachypnea. However, no significant change was observed after apnea and bradypnea.
Source: Authors.
Note: Values are represented as mean ± SE (***p < .001).
