
Figure 1.
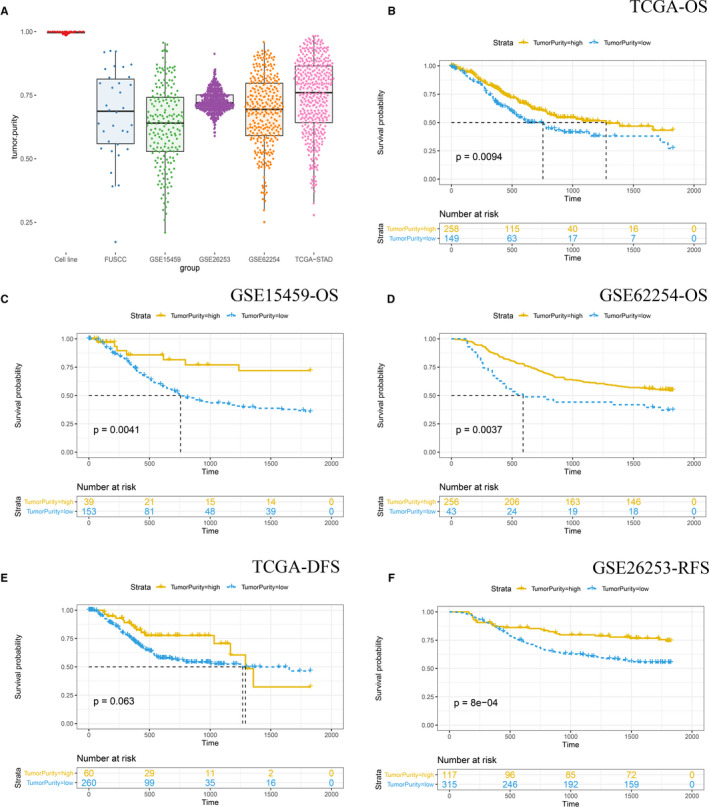
(A) The distribution of tumor purity in 37 cell lines, GSE15459, GSE26253, GSE62254, FUSCC cohort, and TCGA cohort. Kaplan‐Meier analysis of overall survival showed low purity gastric cancer (separated by cutoff tumor purity calculated by ROC analyses) that conferred worse prognosis in TCGA (B), GSE15459 (C), and GSE62254 (D) cohort. Kaplan‐Meier analysis of DFS and RFS showed low purity gastric cancer (separated by cutoff tumor purity calculated by ROC analyses) that conferred worse prognosis in TCGA (E), and GSE26253 (F) cohort, respectively