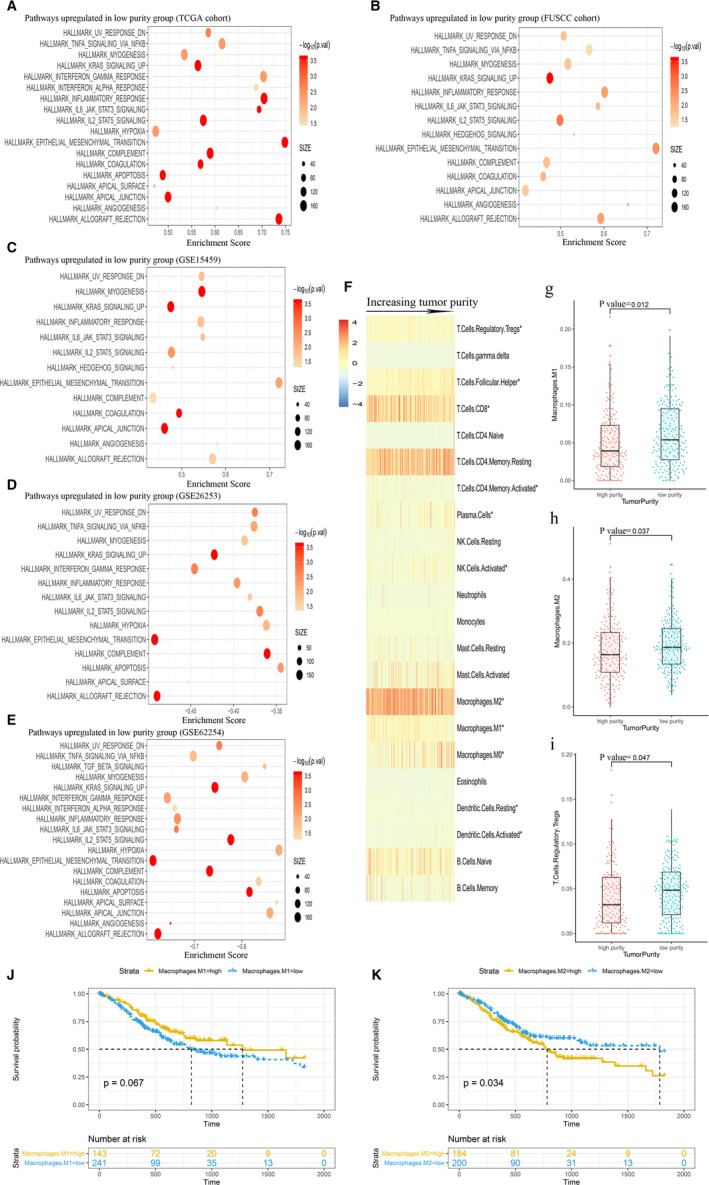
Figure 3.

Immune‐related pathways were highly enriched in low‐purity group: (A) TCGA cohort, (B) FUSCC cohort, (C) GSE15459, (D) GSE26253, (e) GSE62254. (F) The distribution of relative proportion of immune cells sorted by increasing purity in TCGA data set. (G, H, and I) The differences between different purity groups in M1 macrophages, M2 macrophages and Tregs infiltrating. Kaplan‐Meier analysis of overall survival showed that more M2 macrophages (J) infiltrating conferred worse prognosis in TCGA cohort, however, more M1 macrophages (k) infiltrating was not significantly associated with OS. * The differences between different purity groups in infiltrating immune cells were statistically significant
