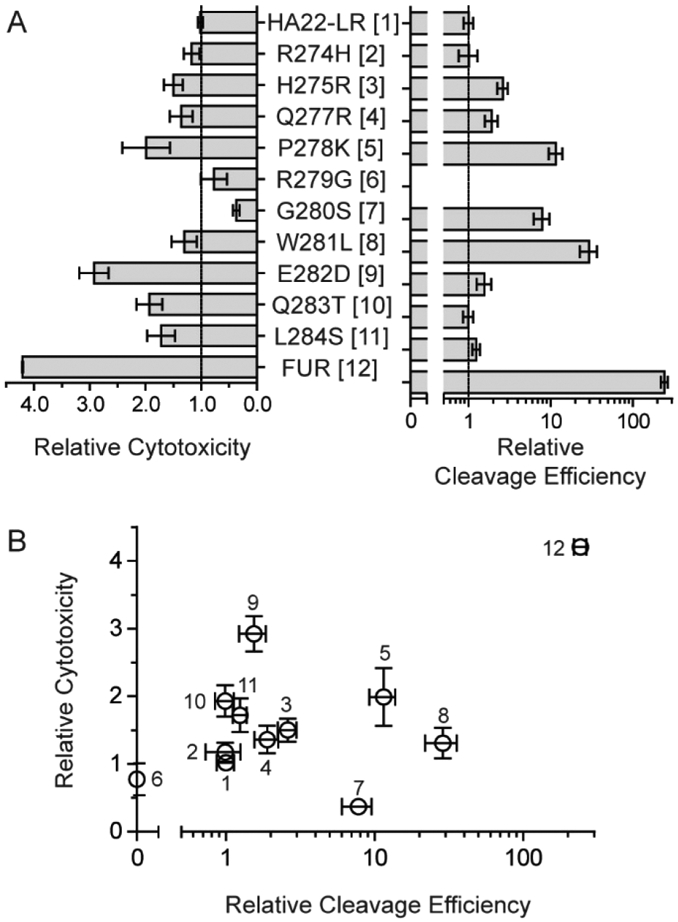
Figure 2.

Properties of furin site mutants. A. Individual point mutations and the FUR multipoint combination mutant at the furin cleavage site of HA22-LR were compared using assays for both cytotoxicity and furin cleavage efficiency. Cytotoxicity is compared here as mean EC50 values of the mutants relative to the HA22-LR. Values are averaged from at least three different assays against the CA46 Burkitt’s lymphoma cell line. Error bars denote standard error of the mean values. The cleavage efficiency is compared here as the cleavage rate of mutants relative to HA22-LR using an in vitro assay followed by SDS-PAGE and band densitometry. Example data for individual RITs is presented in Figure S1. B. A correlation plot comparing relative cytotoxicity with relative cleavage efficiency. Individual proteins are numbered as indicated in panel A.
