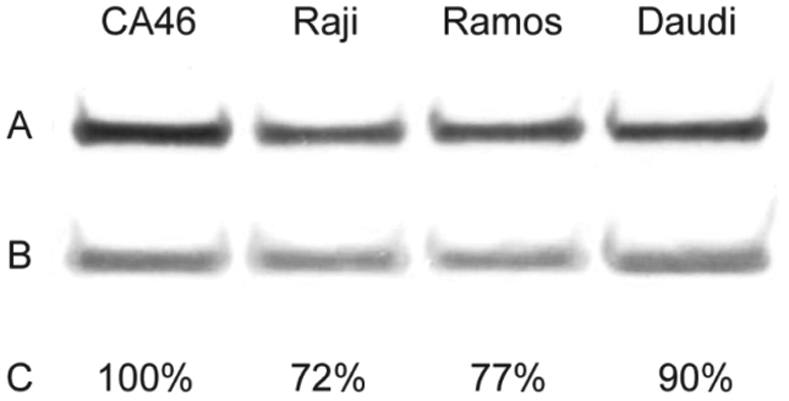
Figure 5.

Furin expression levels. We evaluated lysates of the cell lines CA46, Raji, Ramos, and Daudi for furin by Western blot. Lysates were probed with antibodies for furin (A) and actin (B). The intensity of each band was determined and the ratio of the band densities for each cell line was normalized to CA46 to estimate relative expression levels (C).
