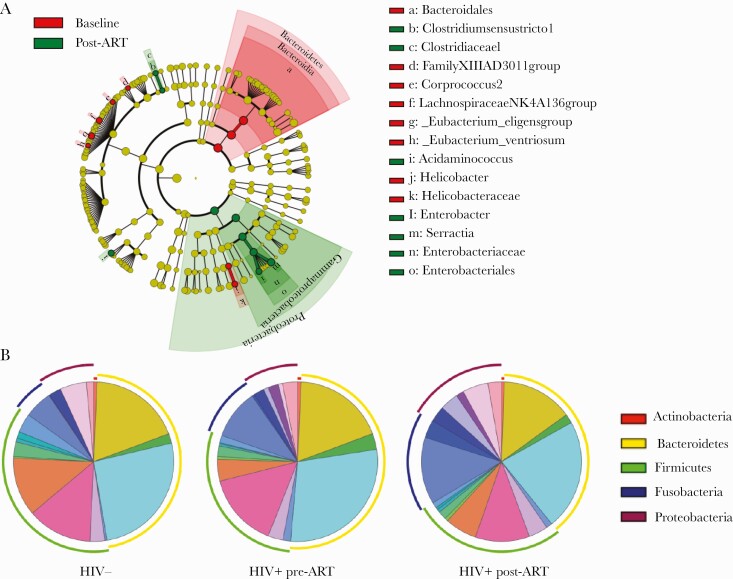
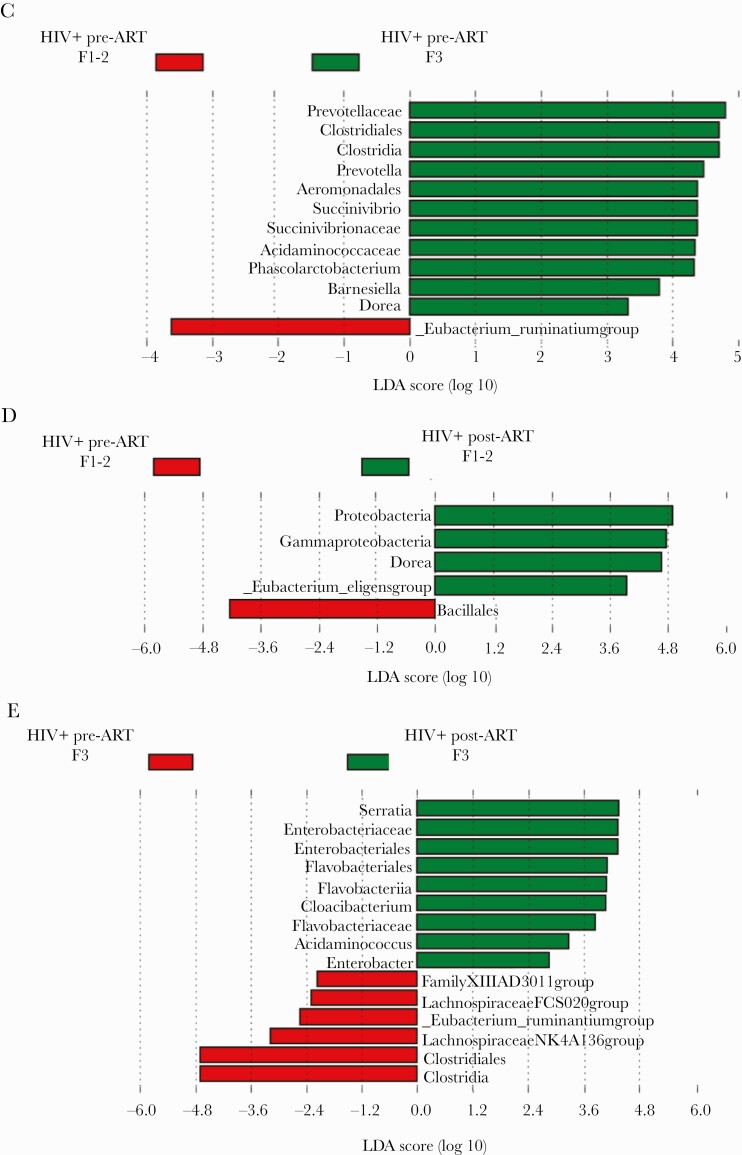
Figure 2.
Gut bacterial changes in HIV+ pre–antiretroviral therapy (ART) and HIV+ post-ART. A, Cladogram of linear discriminant analysis (LDA) effect size highlights discriminatory taxa, with an LDA score >2, between HIV+ pre-ART and HIV+ post-ART. B, Percentage of the top 20 most abundant families in HIV-, HIV+ pre-ART, and HIV+ post-ART (permutation test: HIV- vs HIV+ pre-ART, P = .6; HIV- vs HIV+ post-ART, P = .4; HIV+ pre-ART vs HIV+ post-ART, P = .3). C, LDA scores of differentially abundant taxa among HIV+ pre-ART at F1-2 and HIV+ pre-ART at F3. D, LDA scores of differentially abundant taxa among HIV+ pre-ART at F1-2 and HIV+ post-ART at F1-2. E, LDA scores of differentially abundant taxa among HIV+ pre-ART at F3 and HIV+ post-ART at F3.


