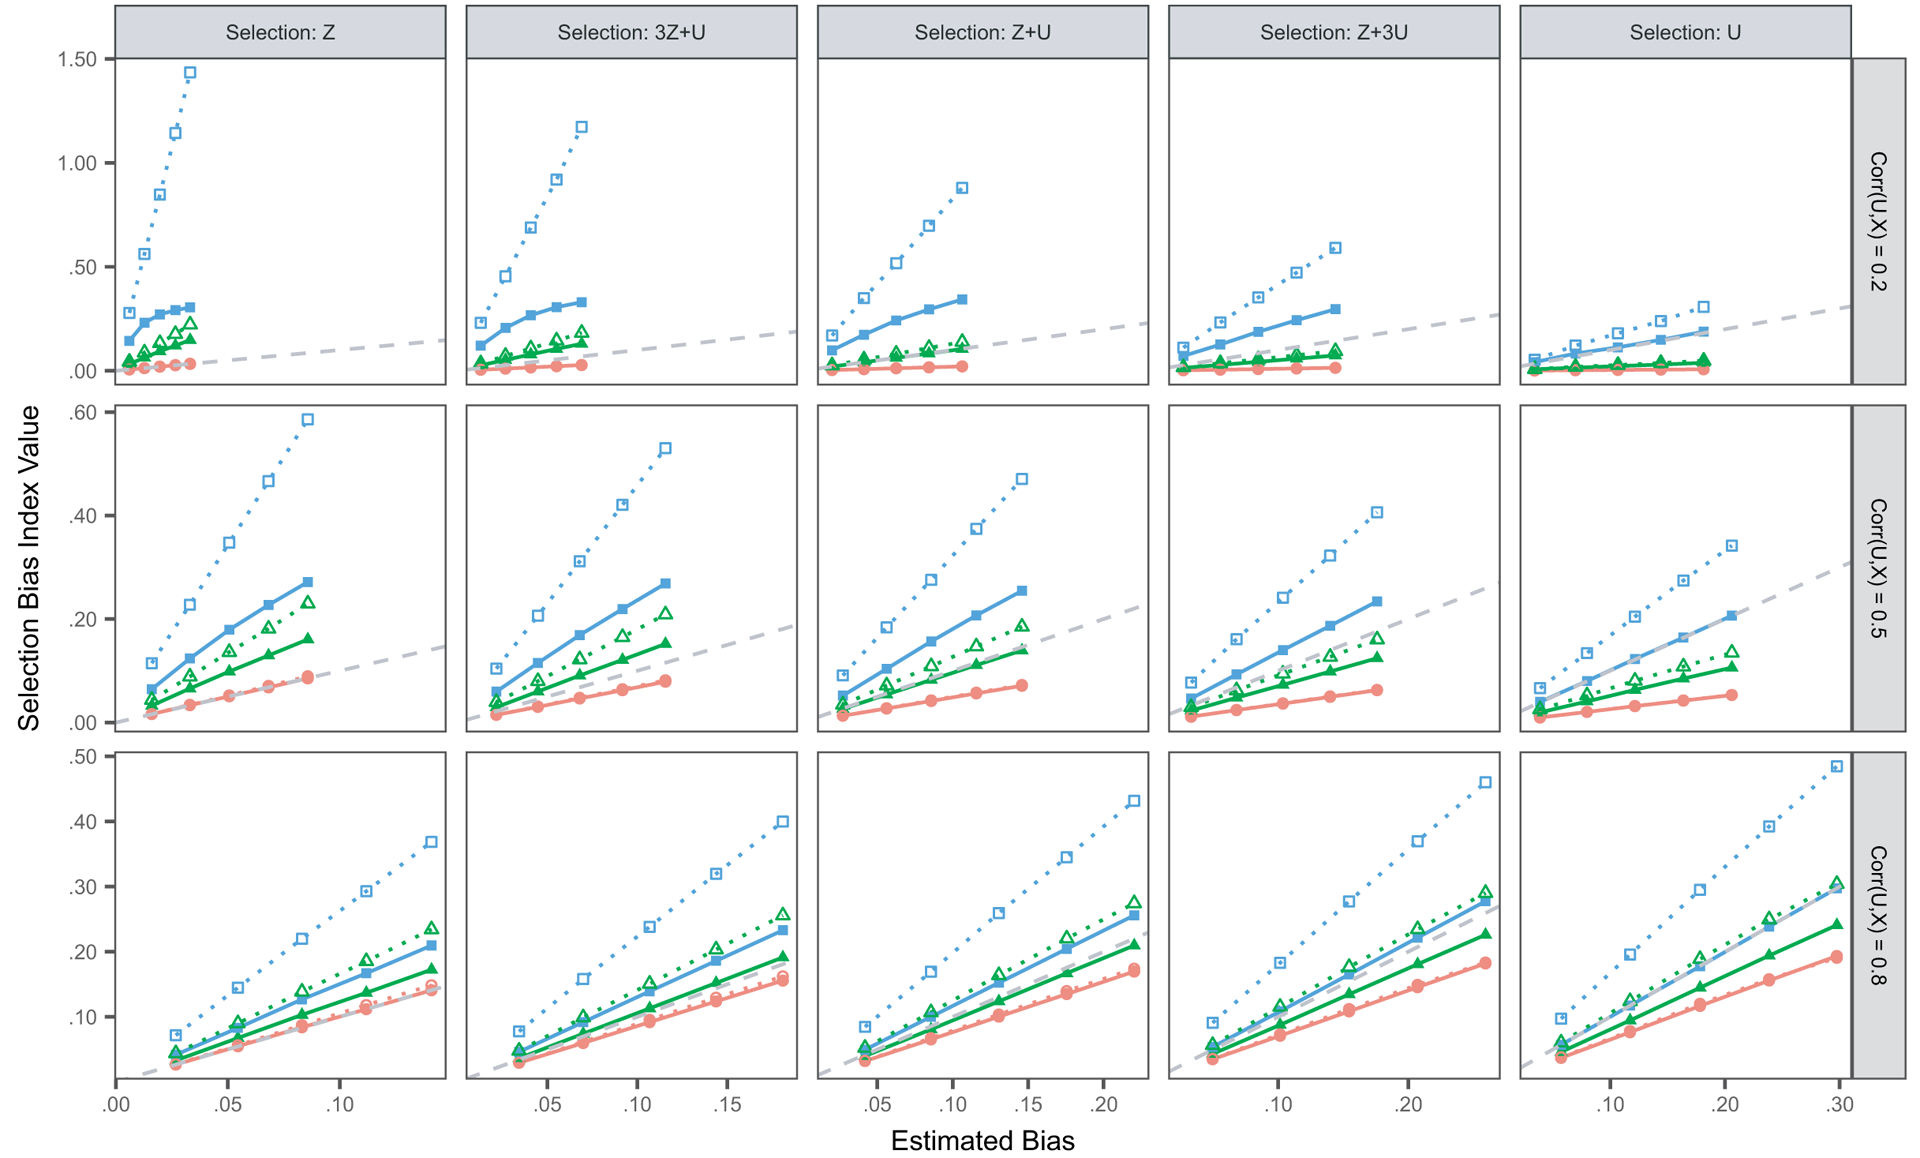
Fig. 1.

MUBP(ϕ) from the probit model and MUB(ϕ) from the normal model versus the true estimated bias, shown for combinations of the biserial correlation corr(U, X)=ρux (rows) and the selection mechanism (columns), for E[Y]=0.3 (results are medians across 1000 simulated data sets for each scenario): ●, probit, MUBP(0); ▲, probit, MUBP(0.5); ■, probit, MUBP(1); ○, normal, MUBP(0); △, normal, MUBP(0.5); □, normal, MUBP(1); – – –, equality (index=estimated bias)
