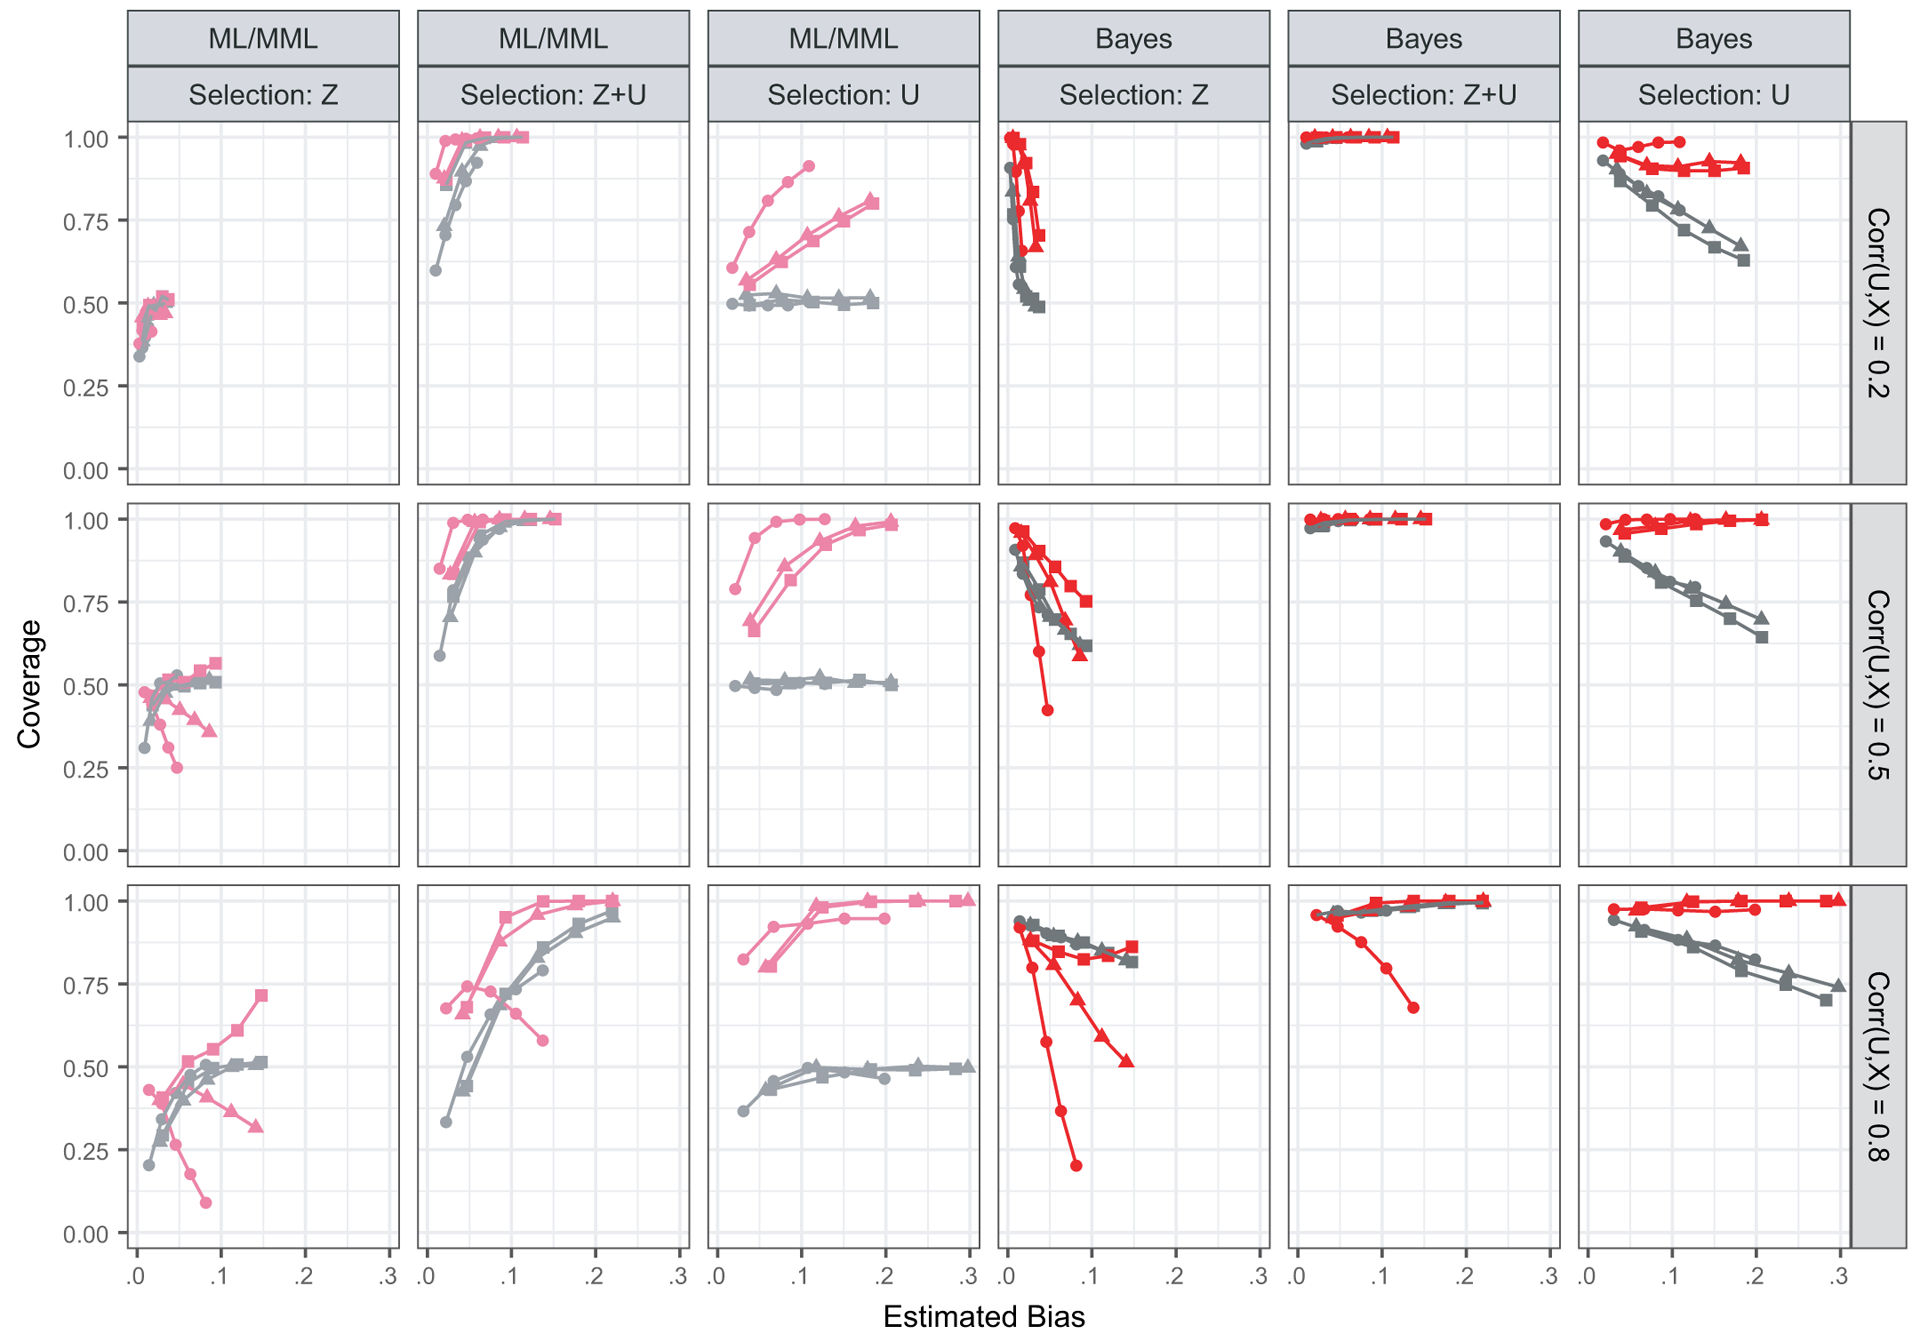
Fig. 3.

Coverage of [MUBP(0), MUBP(1)] and [SMUB(0), SMUB(1)] ML or MML intervals, and Bayesian credible intervals, shown as a function of the true estimated bias (x-axis), selection mechanism and estimation method (columns), proxy strength (rows) and E[Y] (shape) (coverages are estimated from 1000 simulated data sets): ●, normal–ML; ●, probit–MML; ■, normal–Bayes; ■, probit–Bayes; ●, E[Y]=0.1; ▲, E[Y]=0.3; ■, E[Y]=0.5
