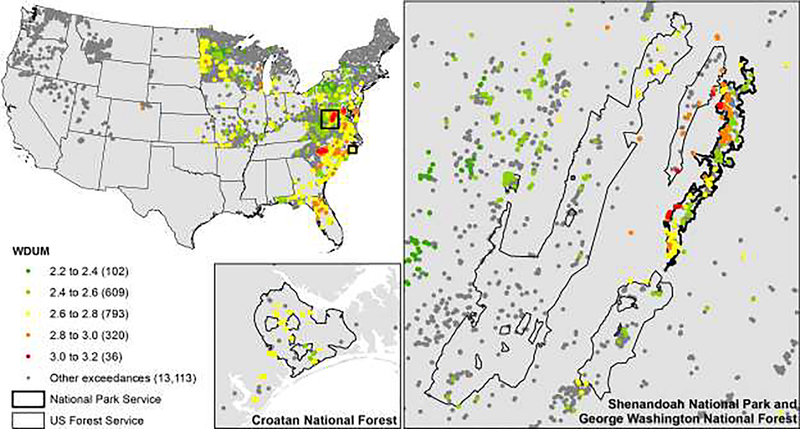
Figure 6.
WDUM for near exceedances (± 2 kg ha−1 yr−1) of the herbaceous richness critical load based on TDep total N deposition 2013–2015. Inset maps show distribution of survey plots from Simkin et al., 2016 within Croatan National Forest, George Washington National Forest, and Shenandoah National Park.

