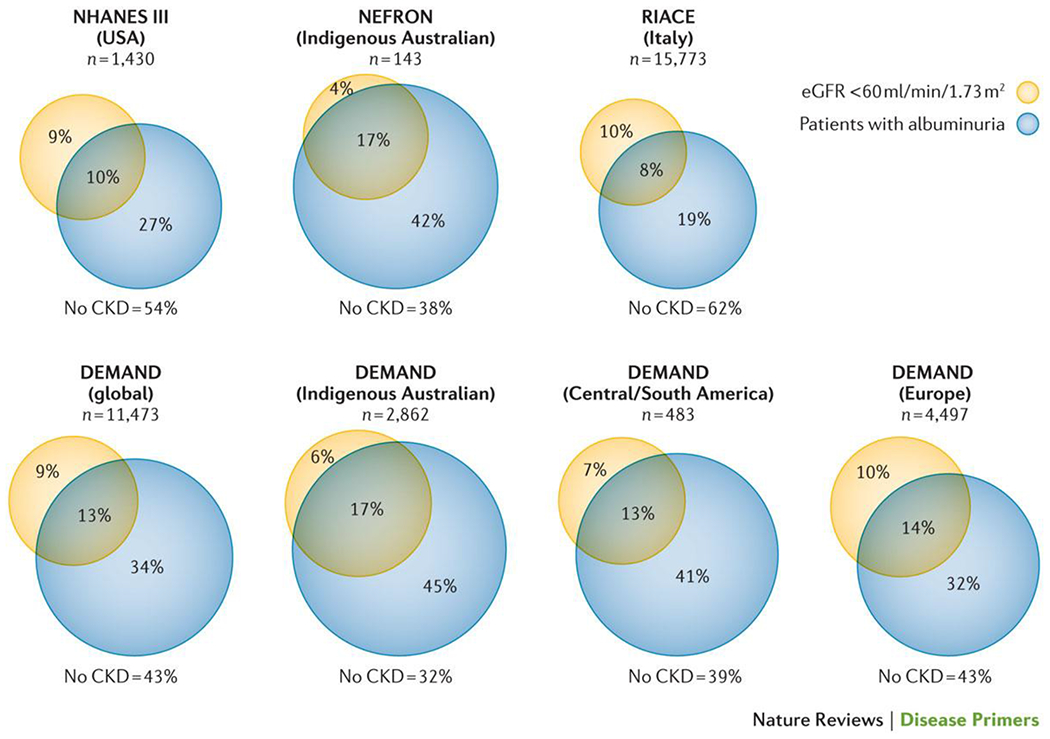
Figure 1. The prevalence of CKD in different populations with type 2 diabetes.

Data from patients with type 2 diabetes surveyed in the DEMAND study21, US NHANES III4, the Australian NEFRON study5 and the Italian RIACE study20. Yellow circle denotes the percentage with an eGFR of <60 ml/min/1.73 m2. Blue circle denoted patients with albuminuria. The percentage not included in either circle denotes patients without CKD.
