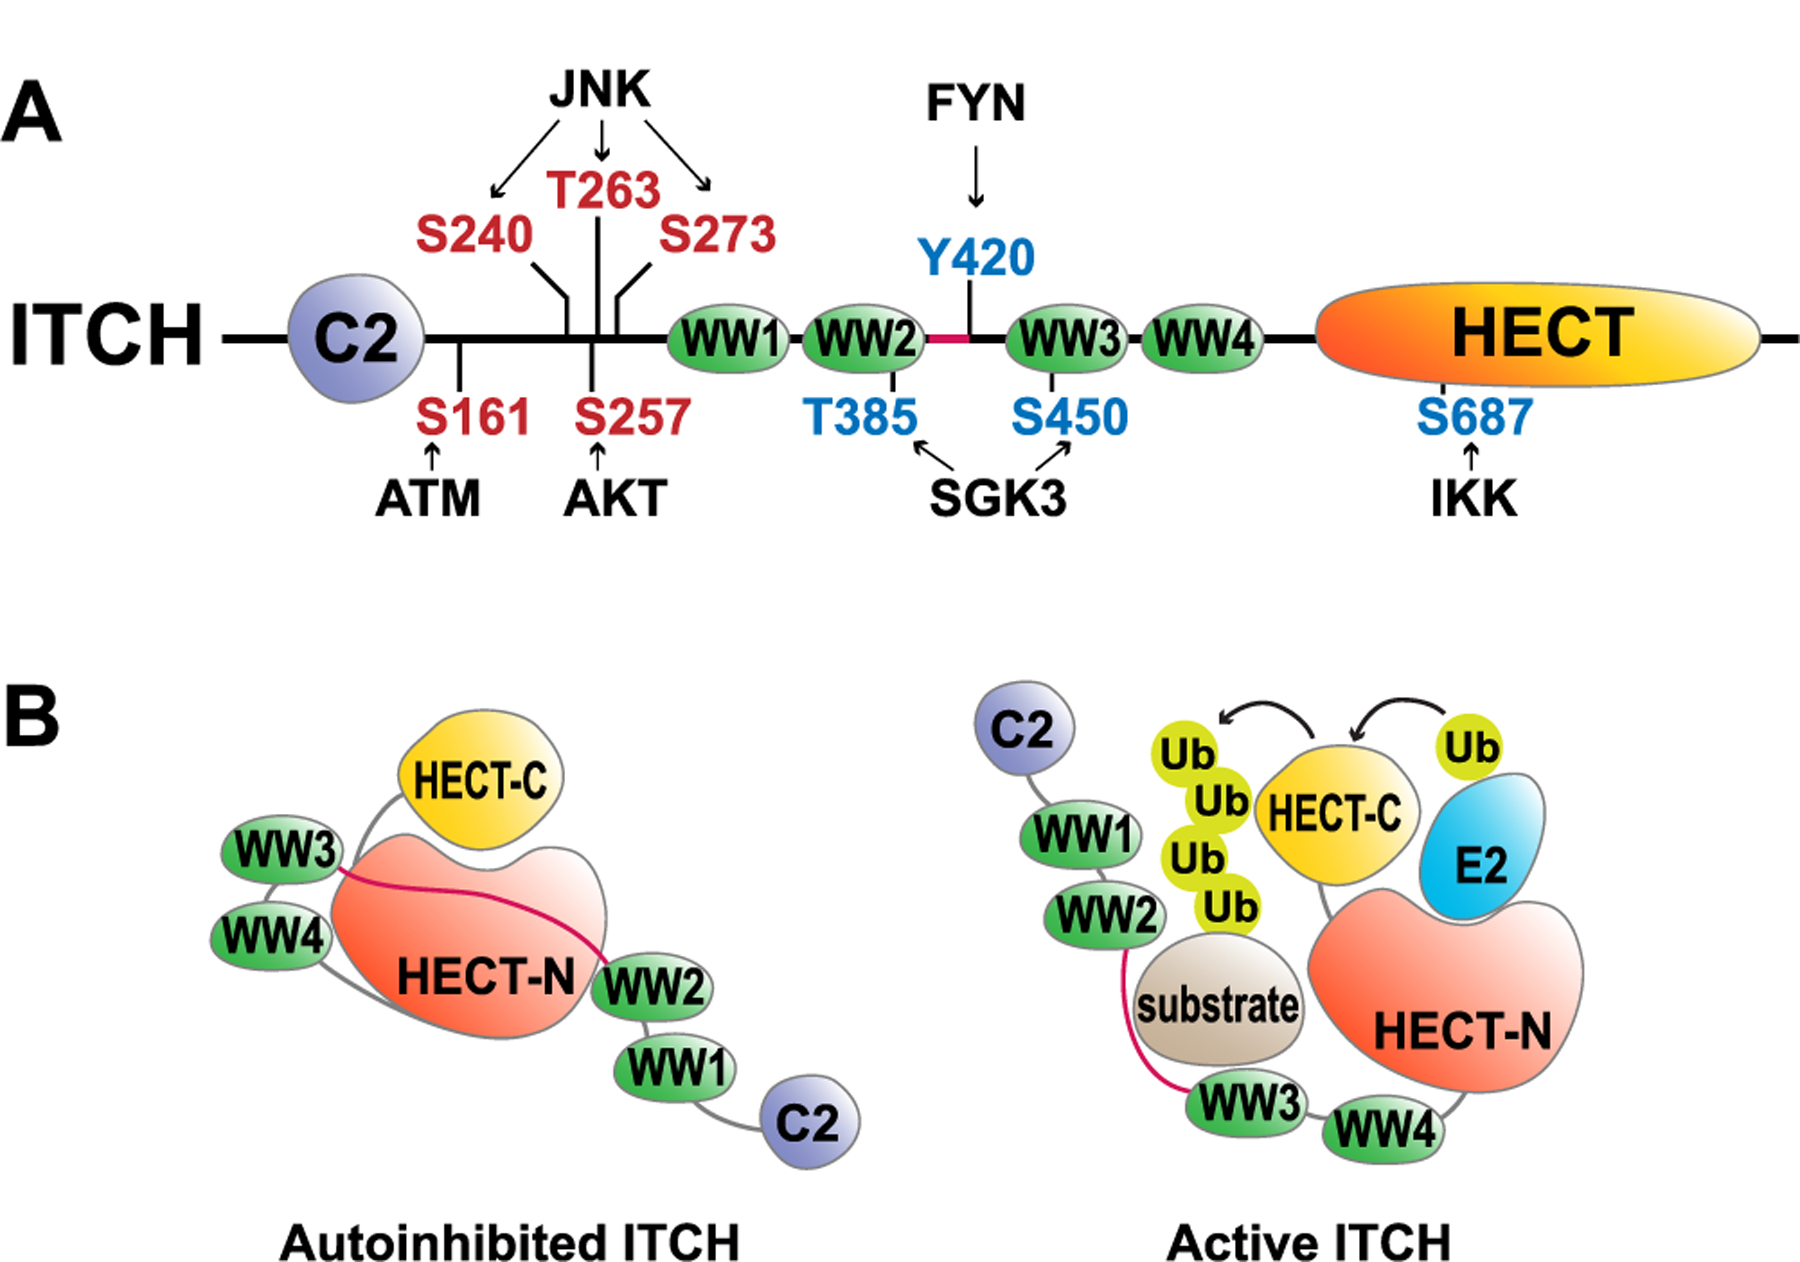
Fig. 1.

Schematic illustration of ITCH activation and regulatory mechanisms.
A) The domain structure of the human ITCH protein. The red residues indicate activation phosphorylation sites, while the blue residues indicate inhibitory phosphorylation sites. B) Inactive and active conformations of the ITCH protein based on the structural studies [27,28].
