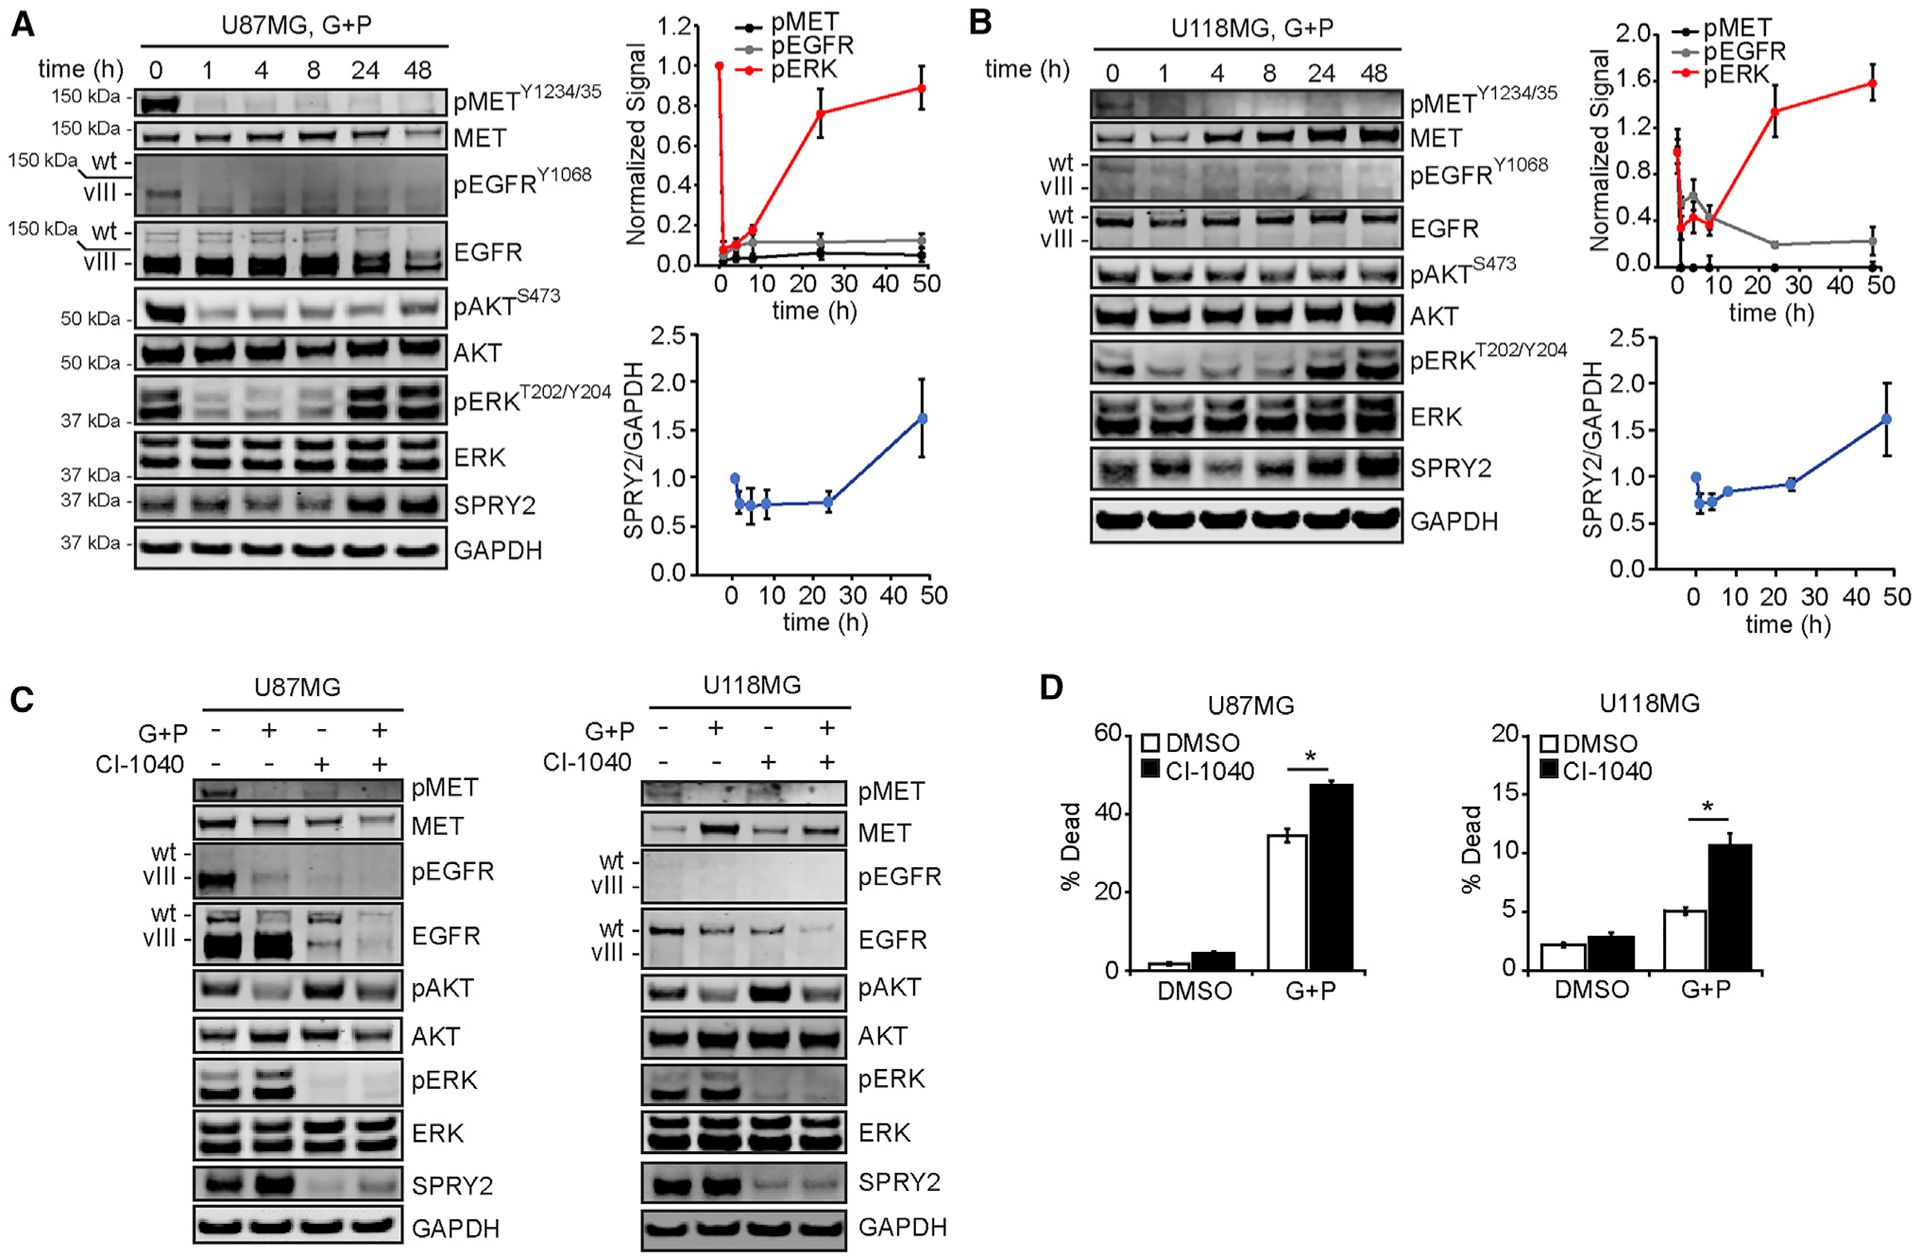
Figure 1. ERK Reactivation Drives SPRY2 Expression and Cellular Survival in Response to EGFR and MET Inhibition.

(A and B) U87MG (A) and U118MG cells (B) were treated for ≤48 h with 10 μM gefitinib (G) + 3 μM PHA665752 (P). Cell lysates were analyzed by western blotting using antibodies against the indicated proteins, with signals quantified by densitometry and normalized to values at t = 0 h.
(C) U87MG and U118MG cells were treated for 48 h with 10 μM G + 3 μM P, 10 μM CI-1040, G + P + CI-1040, or DMSO. Cell lysates were generated and analyzed by western blotting using antibodies against the indicated proteins.
(D) For the same treatments in (C), cell death was measured by flow cytometry.
Throughout the figure panels, representative blot images are shown, and error bars indicate means ± SEMs for three replicates; *p < 0.05 for the indicated comparisons.
