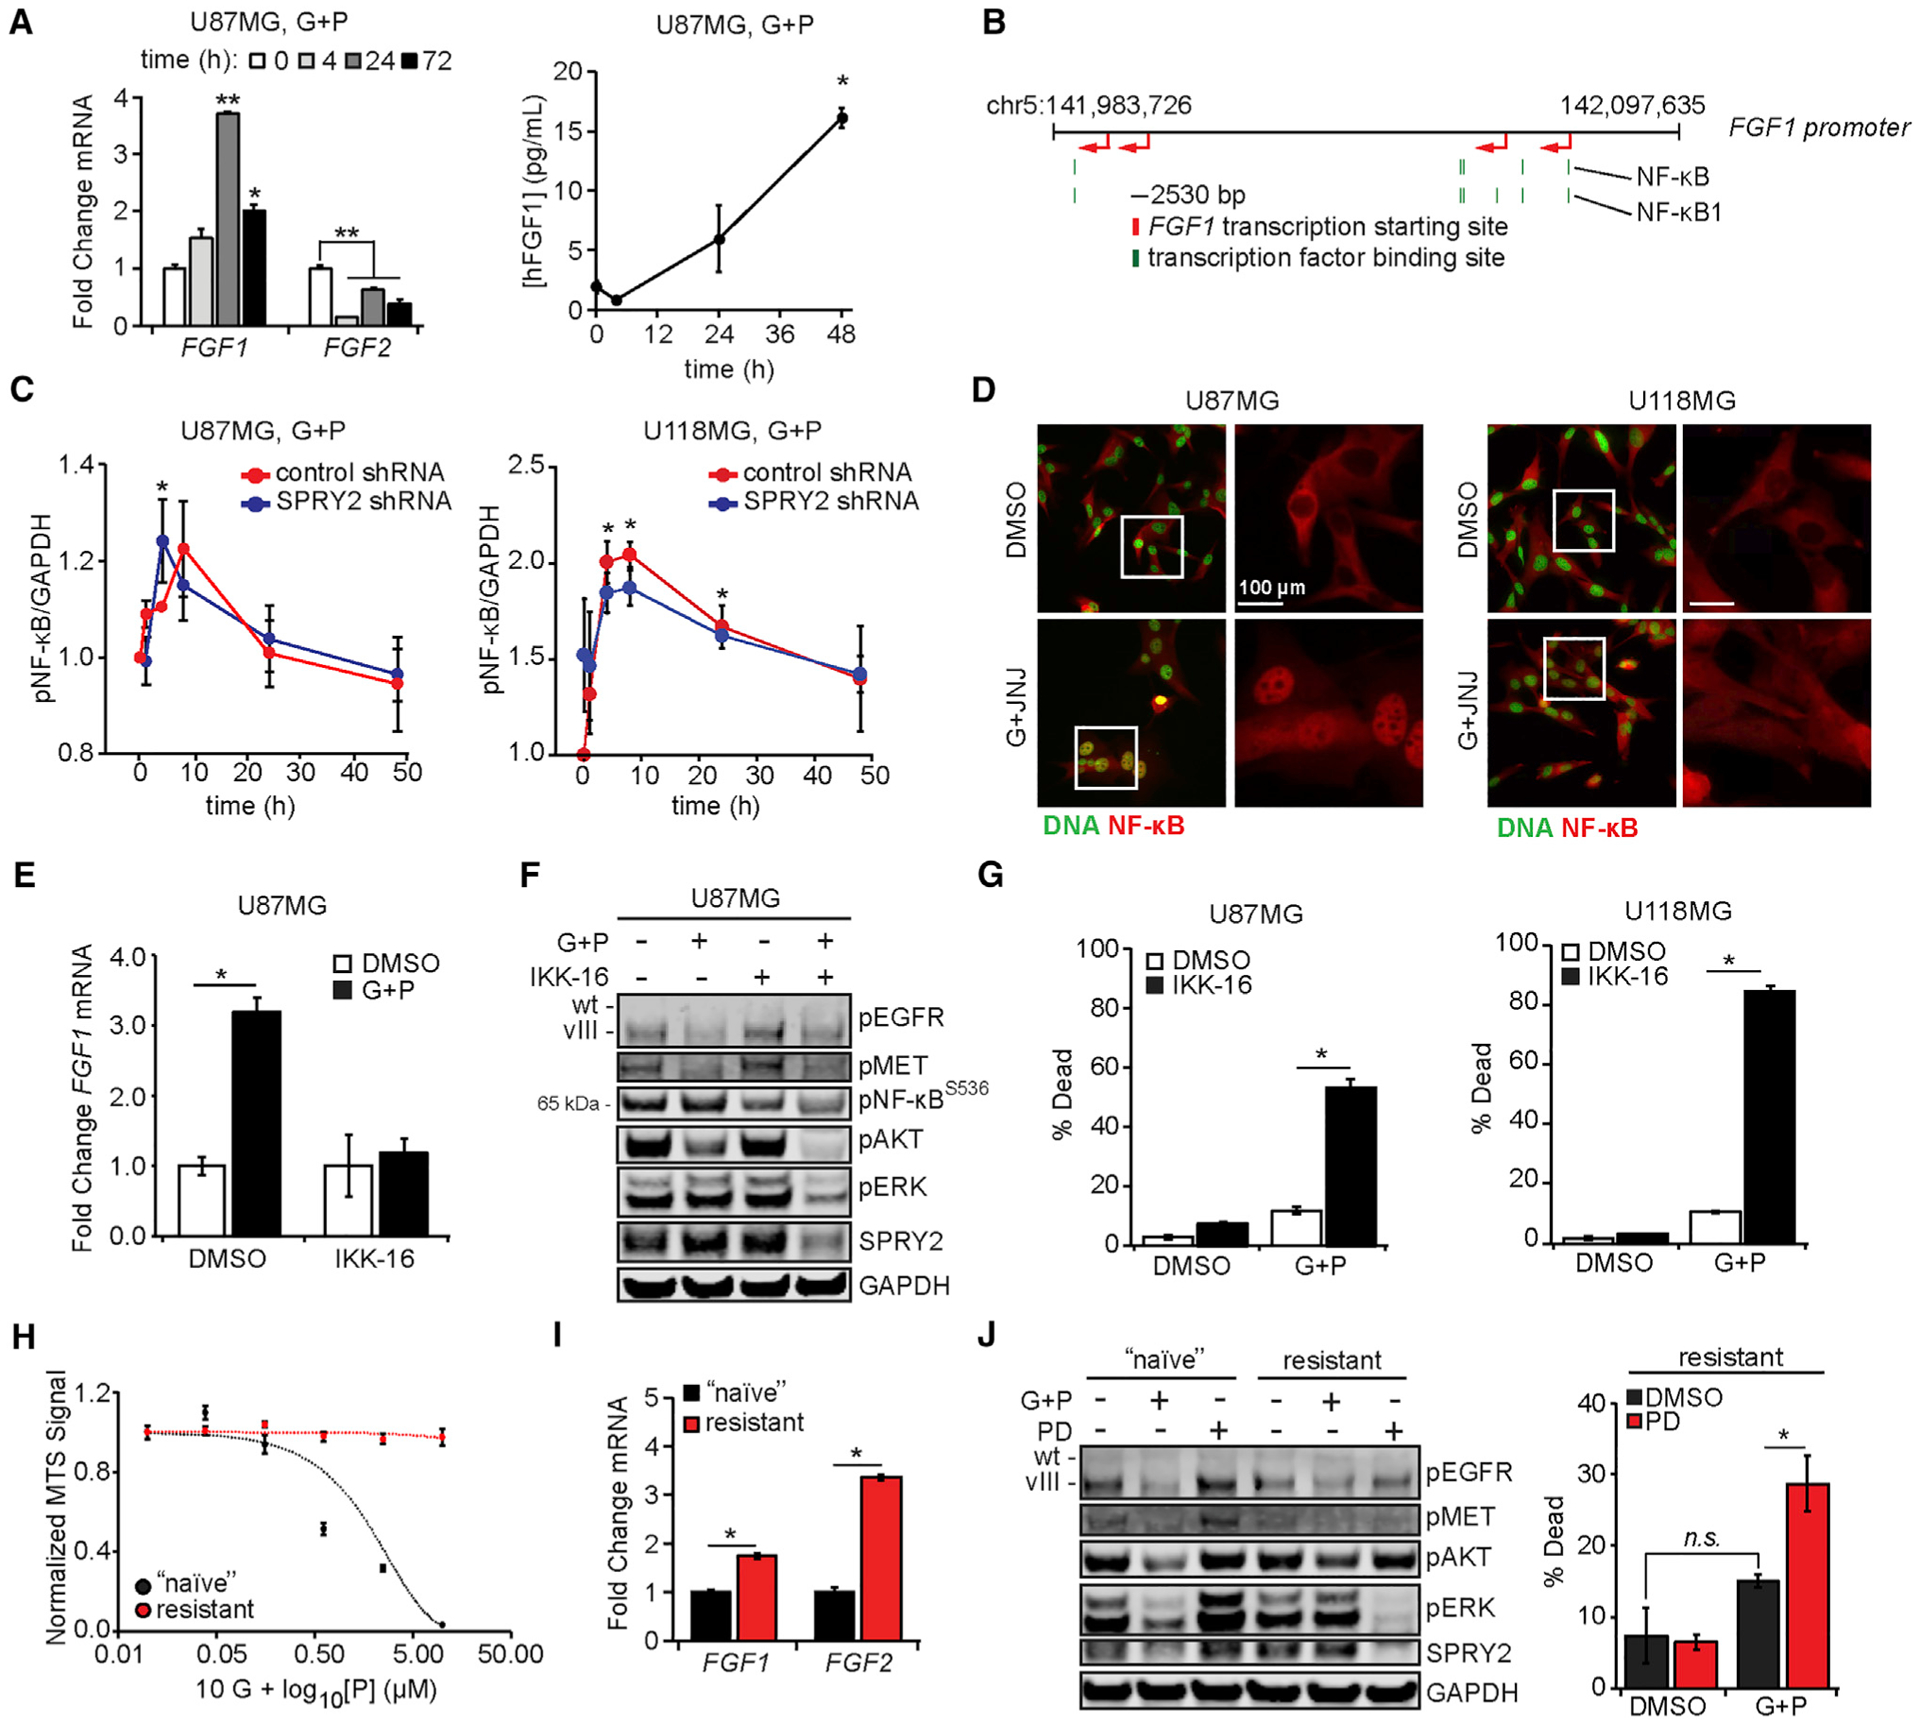
Figure 4. FGF Ligands Are Expressed Due to NF-κB Activity.

(A) U87MG cells were treated with 10 μM gefitinib (G) + 3 μM PHA665752 (P) for the indicated times, and RNA was extracted. qRT-PCR was performed using primers for FGF1 and FGF2. In parallel, conditioned medium was collected from cells treated with 10 μM G + 3 μM P and analyzed for human FGF1 by ELISA.(B) The schematic shows the positions of NF-κB and NF-κB1 binding sites (green) in the FGF1 promoter relative to predicted FGF1 transcription start sites (red).
(C) U87MG and U118MG cells expressing control or SPRY2-targeting shRNA were treated with 10 μM G + 3 μM P for ≤48 h. Cell lysates were analyzed by western blotting, with pNF-κB signal quantified by densitometry.
(D) U87MG and U118MG cells were treated for 4 h with 10 μM G + 5 μM JNJ-38877605 (JNJ) or DMSO. Cells were stained for NF-κB and DNA. Quantification of NF-κB nuclear intensity is shown in Figure S4C.
(E) U87MG cells were treated with 10 μM G + 3 μM P, 0.5 μM IKK-16, G + P + IKK-16, or DMSO for 6 h, and RNA was extracted. qRT-PCR was performed using primers for FGF1.
(F) U87MG cells were similarly treated for 24 h. Lysates were analyzed by western blotting using antibodies against the indicated proteins. Quantifcation of pERK by densitometry is shown in Figure S4F.
(G) U87MG and U118MG cells were similarly treated (24 h for U87MG, 48 h for U118MG), and cell death was measured by flow cytometry.
(H) G + P-resistant or -naive U87MG cells were treated with 10 μM G + P (10 nM–10 μM) for 24 h. Cell viability was measured by MTS assay.
(I) RNA was extracted from G + P-resistant or -naive U87MG cells, and qRT-PCR was performed using primers for FGF1 and FGF2.
(J) G + P-resistant or -naive U87MG cells were treated with 10 μM G + 3 μM P or 0.5 μM PD173074 (PD) for 4 h. Cell lysates were analyzed by western blotting using antibodies against the indicated proteins. In parallel, G + P-resistant cells were treated with G + P, PD, G + P + PD, or DMSO for 48 h, and cell death was measured by flow cytometry.
Throughout the figure panels, representative blot images are shown, and error bars indicate means ± SEMs for three replicates; *p < 0.05 and **p < 0.01 for comparison to t = 0 h, unless comparison indicated.
