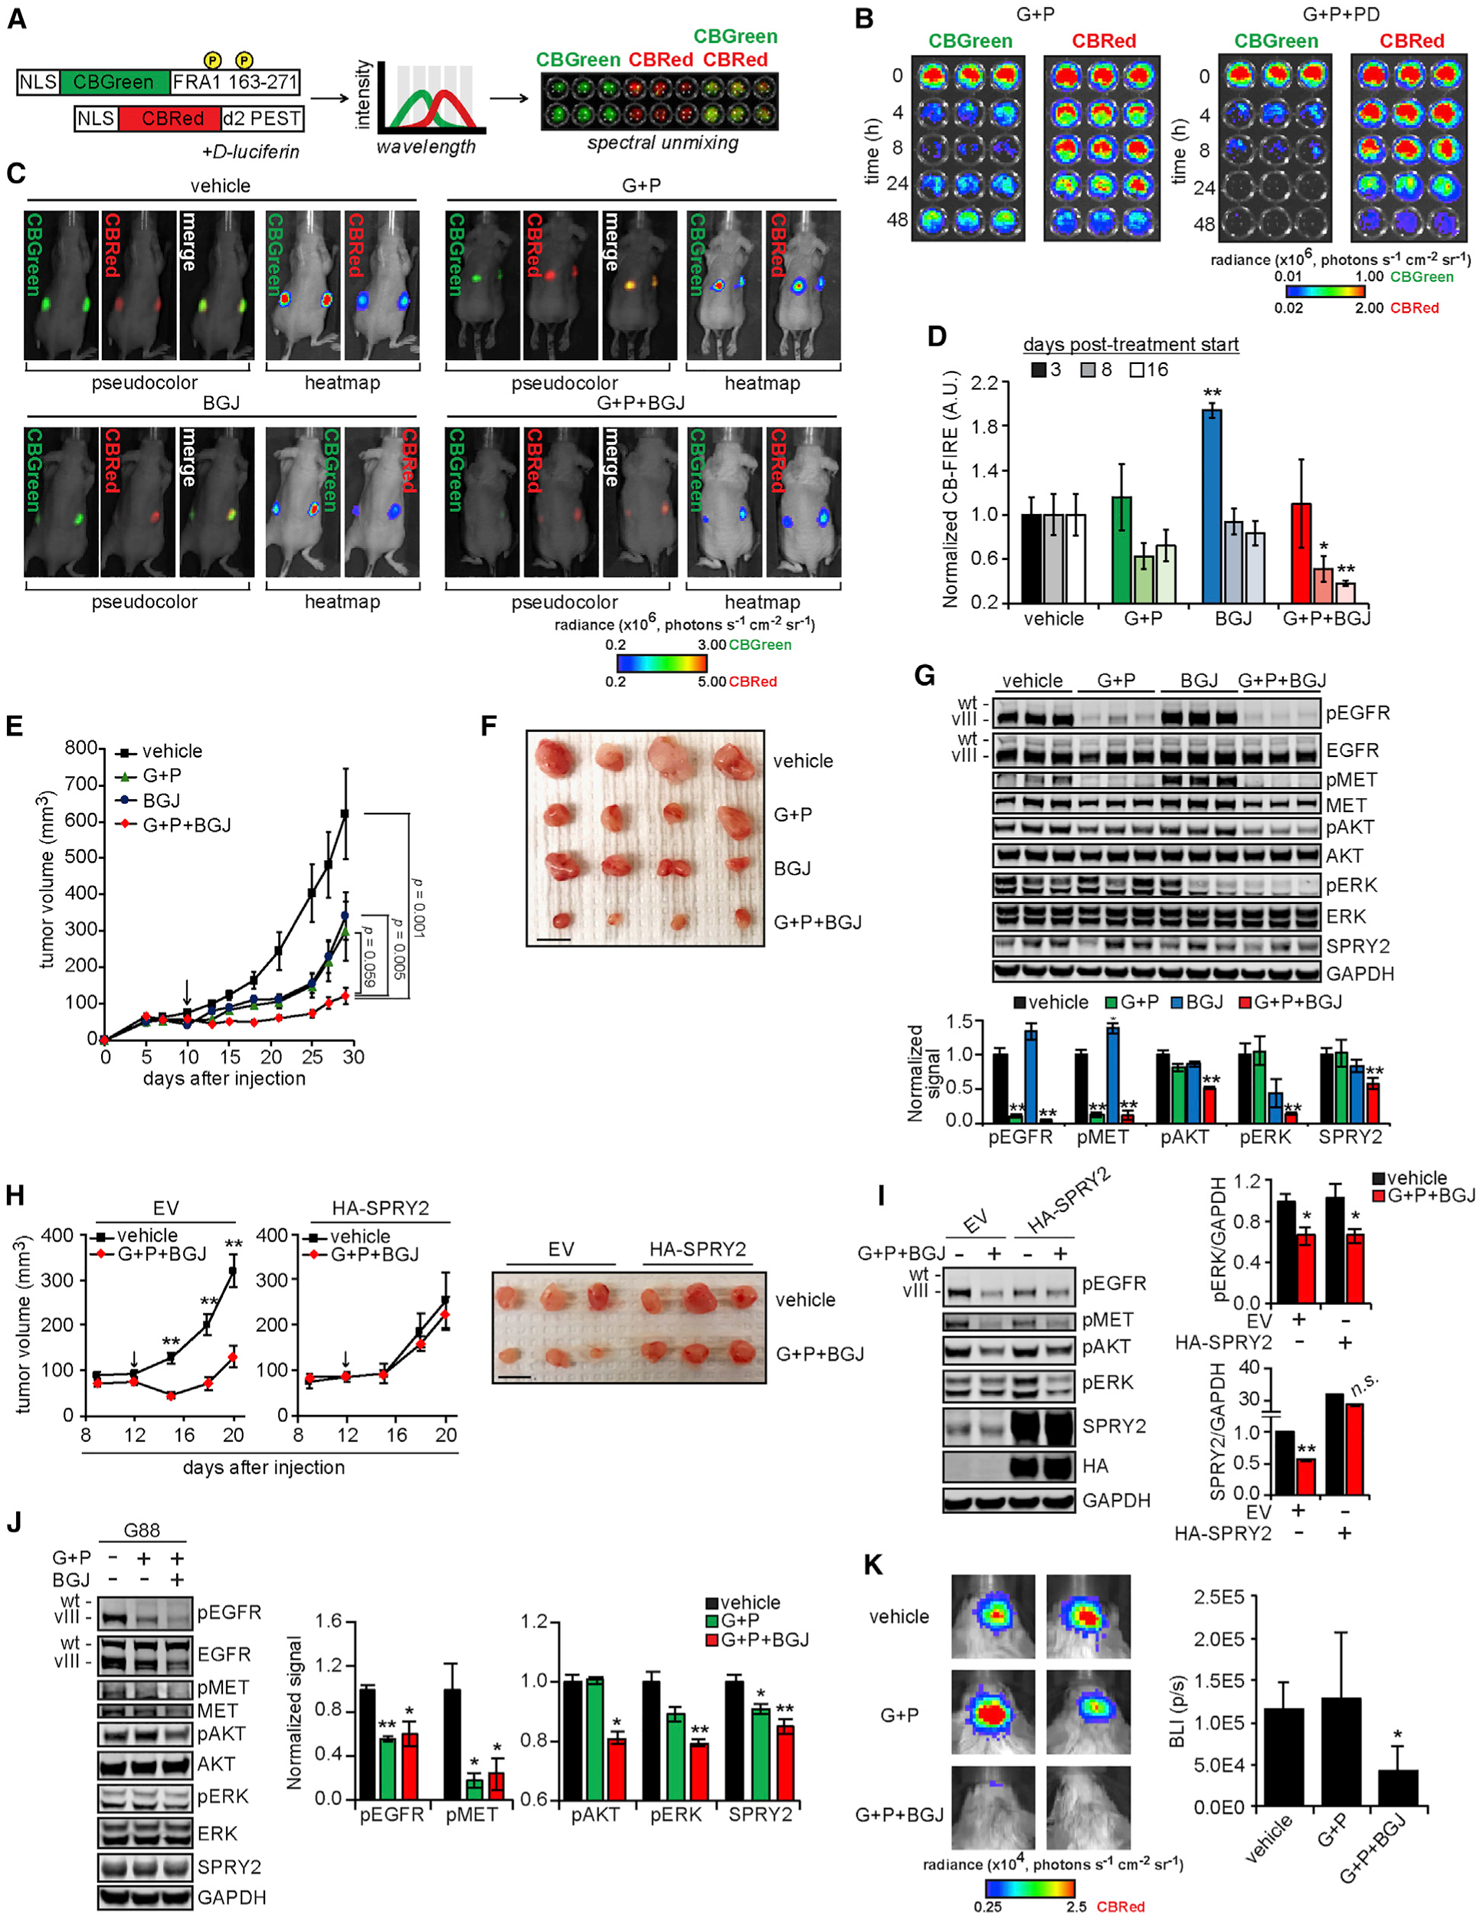
Figure 6. FGFR-ERK-SPRY2 Bypass Signaling Drives Resistance to EGFR and MET Inhibition In Vivo.

(A) The design of click beetle (CB) luciferase-based reporters of ERK activity (CB-FIRE system) was based on the design of the FIRE reporter system. Bioluminescent imaging of cells expressing the CB-FIRE reporters (CBGreen, ERK dependent; CBRed, control) with spectral unmixing allowed for the simultaneous detection of signals from both luciferases.
(B) U87MG cells expressing CB-FIRE reporters were treated with 10 μM gefitinib (G) + 3 μM PHA665752 (P) ± 0.5 μM PD173074 (PD) for the indicated times before the addition of d-luciferin and bioluminescent imaging.
(C) Subcutaneous xenograft tumors were formed in mice using U87MG cells expressing the CB-FIRE reporters, and mice were imaged 8 days after starting indicated treatments (G, 100 mg/kg; P, 30 mg/kg; BGJ398 [BGJ], 20 mg/kg). Representative images of unmixed luciferase signals, with radiance pseudo-colored for qualitative comparison or as a heatmap for quantitative comparison, overlaid with photographs of animals are shown.
(D) CBGreen-CBRed photon flux values, normalized to values for vehicle treatments are shown for 3, 8, or 16 days after treatment began.
(E) Tumor volumes were measured every 2 to 3 days for ≤29 days after cell injection (n = 10 tumors for each treatment group). Indicated statistical comparisons are for final tumor volumes. Arrow indicates treatment start.
(F) Representative excised tumors from each group are shown. Scale bar, 10 mm.
(G) Tumor lysates (n = 3 per group) were analyzed by western blotting using antibodies against the indicated proteins, with signals quantified by densitometry.
(H) Subcutaneous xenograft tumors were formed in mice using U87MG cells expressing HA-tagged SPRY2 (HA-SPRY2) or transduced with empty vector (EV), and mice were treated with the indicated treatments (G, 100 mg/kg; P, 30 mg/kg; BGJ, 20 mg/kg). Tumor volumes were measured every 3 days for ≤20 days after cell injection (n = 8 tumors for each treatment group). The indicated statistical comparisons are between vehicle and G + P + BGJ group tumor volumes. The arrow indicates treatment start. Representative excised tumors from each group are shown. Scale bar, 10 mm.
(I) Tumor lysates (n = 3 per group) were analyzed by western blotting using antibodies against the indicated proteins, with signals quantified by densitometry.
(J) Orthotopic xenograft tumors were generated in mice using G88 cells expressing the CB-FIRE reporters. Mice were treated daily (5 days on, 2 days off, 4 days on) with the indicated treatments (G, 100 mg/kg; P, 30 mg/kg; BGJ, 30 mg/kg) before euthanasia and harvest of mouse brain hemispheres containing tumors. Lysates generated from mouse brains (n = 4 for vehicle and G + P + BGJ; n = 3 for G + P) were analyzed by western blotting using antibodies against the indicated proteins, with signals quantified by densitometry.
(K) Representative images of unmixed, CBRed luciferase signals from mice treated as described. The range of luminescence values for heatmap images was chosen to demonstrate the differences between vehicle and G + P + BGJ-treated animals most clearly. Quantified bioluminescence intensities (BLI) plotted as photons per second (p/s) are shown.
Throughout the figure panels, representative images are shown, and error bars represent means ± SEMs. *p < 0.05 or **p < 0.01 for comparisons against vehicle control.
