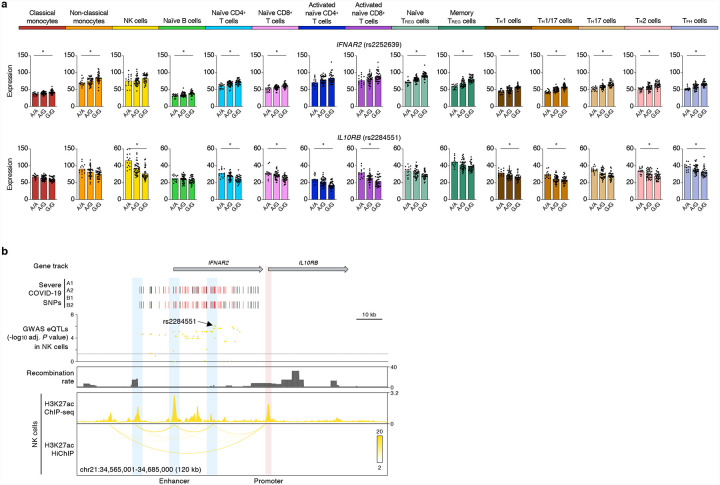
Figure 3. COVID-19-risk variants show cell-type-restriction of their effects on gene expression.
(a) Mean expression levels (TPM) of selected severe COVID-19-risk associated GWAS eGenes (all with GWAS association P value < 5×10⁻⁸) in the indicated cell types from subjects (n=91) categorized based on the genotype at the indicated peak GWAS cis-eQTL; each symbol represents an individual subject, * adj. association P value < 0.05. (b) WashU Epigenome browser tracks for the IFNAR2 and IL10RB loci, severe COVID-19-risk associated GWAS variants (based on GWAS study, see Extended Data Figure 1a; red color bars are lead GWAS SNPs, black color bars are SNPs in linkage disequilibrium), adj. association P value for GWAS cis-eQTLs associated with expression of IL10RB in NK cells, recombination rate tracks27,28, H3K27ac ChIP-seq tracks, and H3K27ac HiChIP interactions in NK cells.

