Fig. 2.
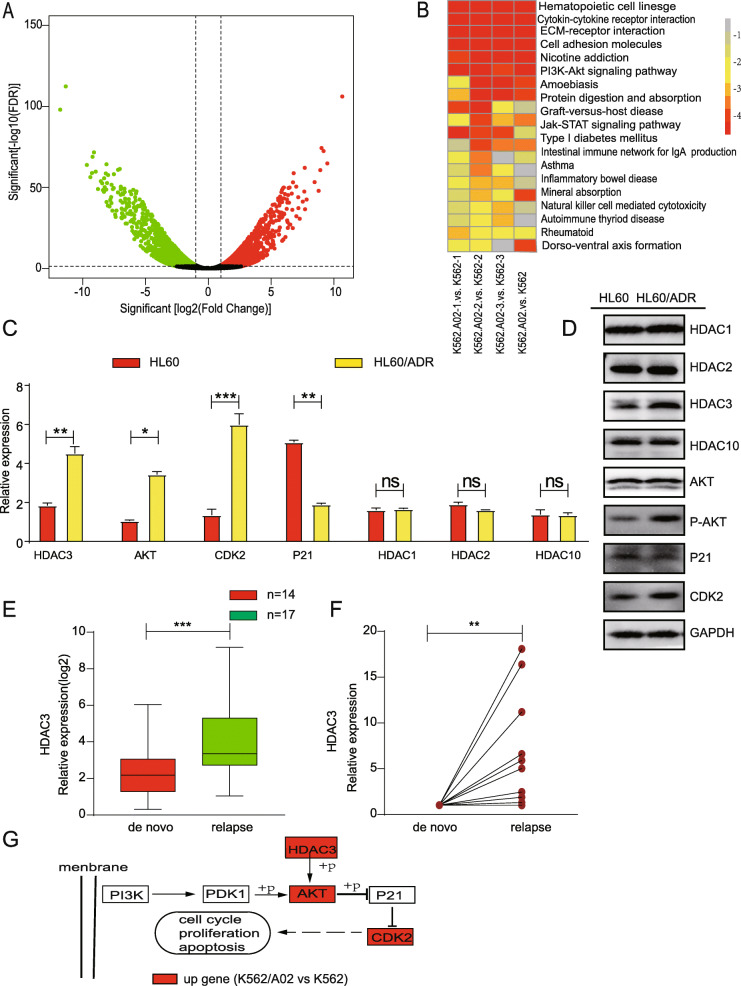
Differential gene and protein expression in K562 and K562/A02. a Total RNA isolated from K562 and K562/A02 was subjected to RNA-sequencing. The Volcano plot of differentially expressed gene level was defined by analysis of variance. b KEGG pathway analyes of differentially expressed genes. c RT-PCR analysis showed differential gene expression in HL60 and HL60/ADR. d Western blot analysis shows protein expression of differential gene in HL60 and HL60/ADR. e HDAC3 expression of relapsed patients measured with RT-PCR was compared to that of de novo counterparts. f The HDAC3 expression of relapsed samples from the same patients measured with RT-PCR was compared to that of its de novo leukemia samples. g Compared with K562 cells, the HDAC3-AKT-P21-CDK2 signaling pathway was activated in K562/A02 cells (red represents higher expression). Data represents three independent experiments, and results shown are in the format, mean ± S.D. (NS: P > 0.05, *P < 0.05, **P < 0.01, ***P < 0.001)

