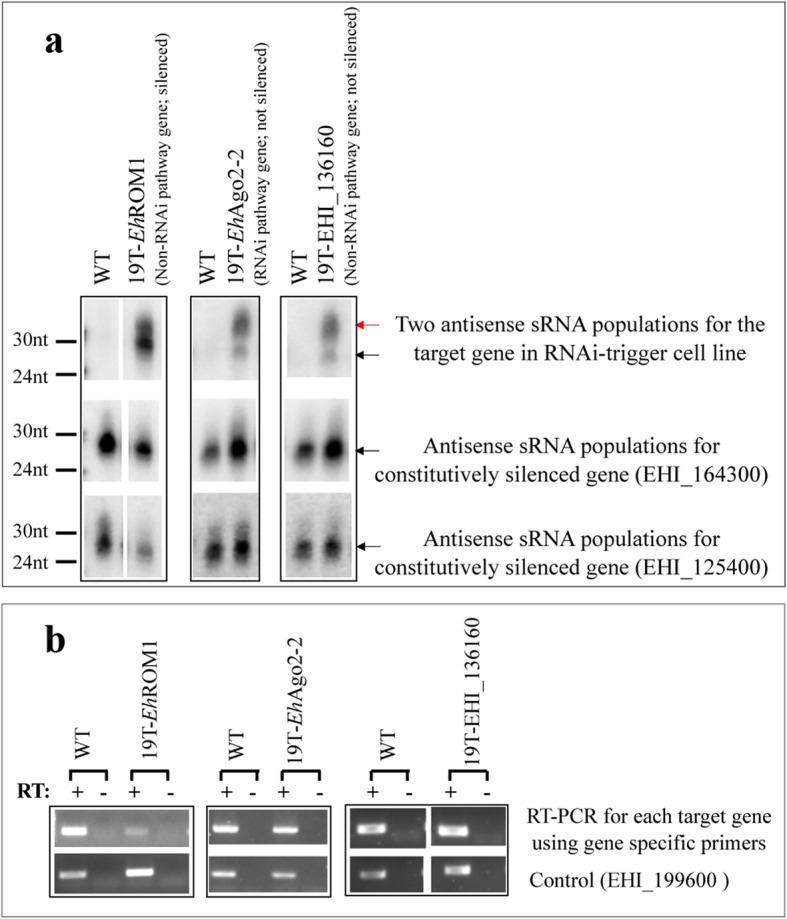
Fig. 2.

Northern blots detect relative abundance of two sRNA populations in RNAi-trigger cell lines. a Northern blot analysis detects antisense sRNA at both 27 nt and 31 nt sizes for each target gene. A gene specific sense probe was used for each target gene, and antisense signals are detected in the respective RNAi-trigger cell line. Relative abundance of sRNA populations: 27 nt > 31 nt in 19 T-EhROM1 cell line with EhROM1 gene silenced; in contrast, 27 nt < 31 nt in cell lines (19 T-EhAgo2–2, 19 T-EHI_136160), where the target genes are not silenced. The ratio of the sRNA bands (31 nt/27 nt) measured by densitometry is 0.57 for 19 T-EhROM1; 6.7 for 19 T-EhAgo2–2 and 7.0 for 19 T-EHI_136160. Antisense sRNAs to constitutively silenced genes EHI_164300 and EHI_125400 as controls, which further demonstrate the relative abundance pattern of 27 nt > 31 nt for the silenced genes. Red arrow points to 31 nt sRNA band, black arrow points to 27 nt sRNA band. See also Suppl. original blots for Fig. 2a. b Semi-quantitative RT-PCRs using gene specific primers. Gene expression levels of target gene were measured in RNAi-trigger cell lines: EhROM1 is silenced but the other two genes have equal expression in WT and RNAi-trigger cell lines. The fold change in gene expression compared to the control: 0.23 for 19 T-EhROM1; 1.45 for 19 T-EhAgo2–2 and 0.95 for 19 T-EHI_136160. EHI_199600 is used as a loading control and -RT samples are shown. All RT-PCRs are specific, as a single band was generated for each primer set
