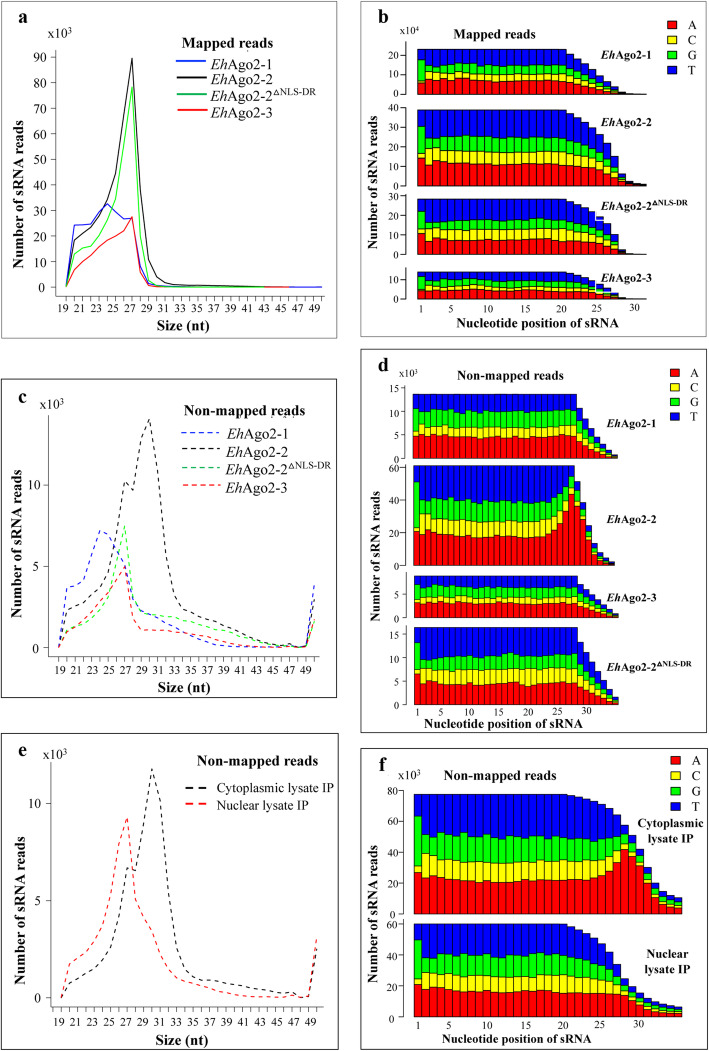
Fig. 4.
Characterization of sRNA populations bound to three EhAgos. a Size distribution of the mapped reads (unique reads). Three EhAgo IP libraries and EhAgo2–2△NLS-DR IP library were made by RppH method. An sRNA 27 nt peak is observed in all IP libraries. Both EhAgo2–2 and EhAgo2–2△NLS-DR show a sharp 27 nt sRNA peak. EhAgo2–1 and EhAgo2–3 have a broad size distribution in addition to the 27 nt sRNA peak, which matches with the sRNA profile seen by pCp labeling. b Nucleotide distribution analysis for the mapped reads. 5′-G bias is evident for the first nucleotide in the mapped sRNA reads from all EhAgo IP libraries. c Size distribution for the non-mapped reads. It shows a peak at 31 nt only in EhAgo2–2 but not in the other two EhAgos or EhAgo2–2△NLS-DR. d Nucleotide distribution analysis for the non-mapped reads. Non-templated oligo-A tailing is present only in the EhAgo2–2 library not in the others. e Size distribution analysis for the non-mapped reads in nuclear and cytoplasmic EhAgo2–2 IP sRNA libraries. The 31 nt population is seen for cytoplasmic but not the nuclear EhAgo2–2 IP sRNA library. f Nucleotide distribution analysis for the non-mapped reads show oligo-A tailing for cytoplasmic EhAgo2–2 IP sRNA library

