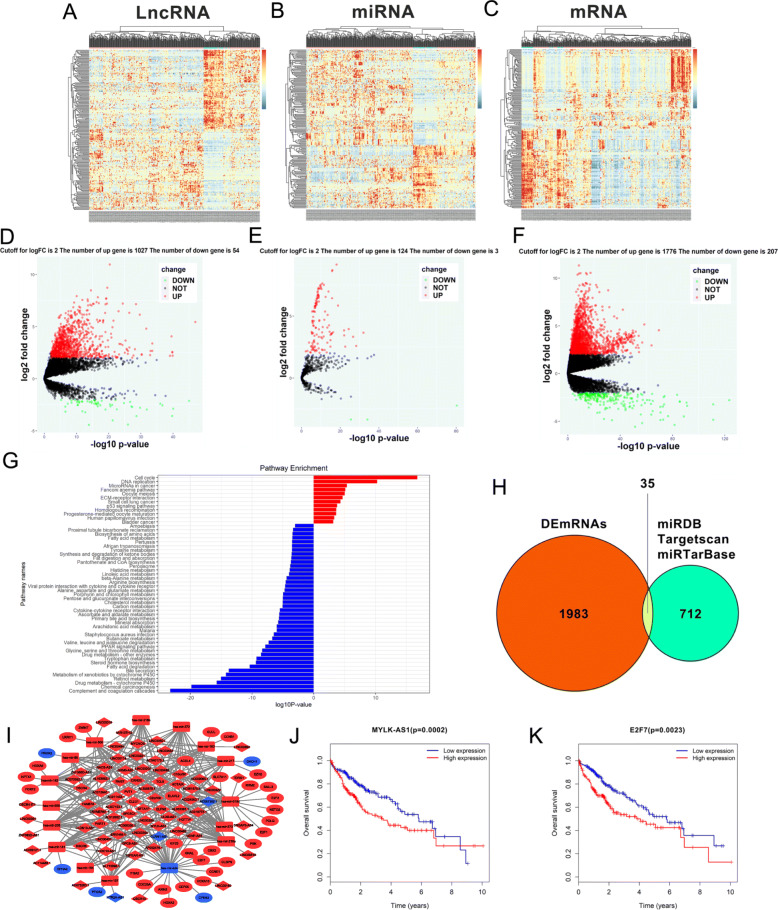
Fig. 1.
RNA-seq data analysis of HCC in TCGA database. a-c Clustered heat maps of the differentially expressed RNAs in HCC tissues and adjacent non-tumor liver tissues. Rows represent RNAs, whereas columns represent HCC tissues and adjacent non-tumor liver tissues. Differentially expressed lncRNAs, miRNAs, and mRNAs in HCC tissues compared to adjacent non-tumor liver tissues were filtered by standard of log2FC > 2 and FDR < 0.01. FC: folds change; FDR: false discovery rate. d-f Volcano plots visualizing and assessing the variation of (D) long non-coding RNAs, (E) microRNAs, and (F) mRNAs expression between HCC tissues and adjacent non-tumor liver tissues. The values of the X-axis the indicate 10log p value and the Y-axis indicate the log2 fold change of the group. g Enriched KEGG pathways for differentially expressed mRNAs (the bar plot shows the enrichment scores of the significantly enriched KEGG pathways). KEGG, Kyoto Encyclopedia of Genes and Genomes. h Identification of 712 changed targeted mRNAs among the 127 DEmiRNAs from the three public profile datasets (miRDB, Targetscan and miRTarBase). The cross areas revealed that the number of commonly changed mRNAs between DEmRNAs and target mRNAs was 35, which included E2F7. i The lncRNA-miRNA-mRNA ceRNA network. Blue squares, downregulated miRNAs; blue circles, downregulated mRNAs; blue diamonds, downregulated lncRNAs. Red squares, upregulated miRNAs; red circles, upregulated mRNAs; red diamonds, upregulated lncRNAs. j-k Kaplan-Meier survival curves for MYLK-AS1 and E2F7 associated with OS

