
Fig. 5.
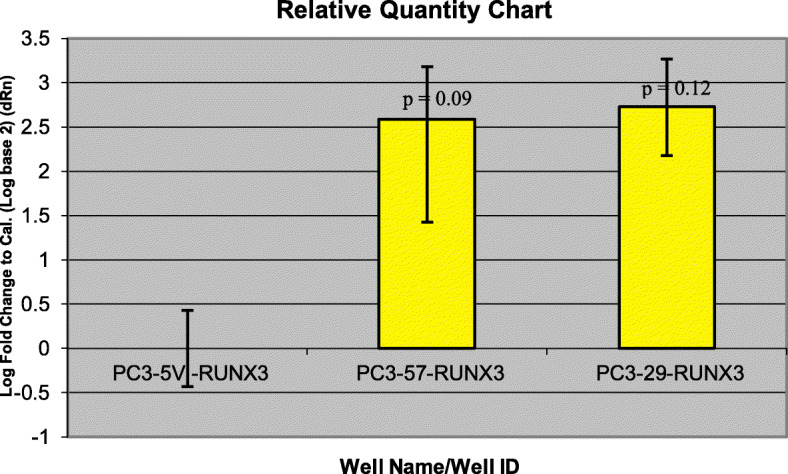
Comparative quantification for RUNX3 gene in PC3 cell lines using qRT-PCR. PC3-5 V cell line was used as the calibrator. Yellow bars represent the log-fold change for the PC3–57 and PC3–29 cell lines compared to PC3-5 V. Fold change were initially calculated for all the three cell lines by subtracting RUNX3 Ct values from the respective cell lines beta actin Ct values. The fold change for PC3-5 V cell lines was equaled to 0 and the values for PC3–57 and PC3–29 were calculated by comparing to PC3-5 V. A t-test performed on the final fold change values yielded p values of 0.12 (PC3–29) and 0.09 (PC3–57) respectively