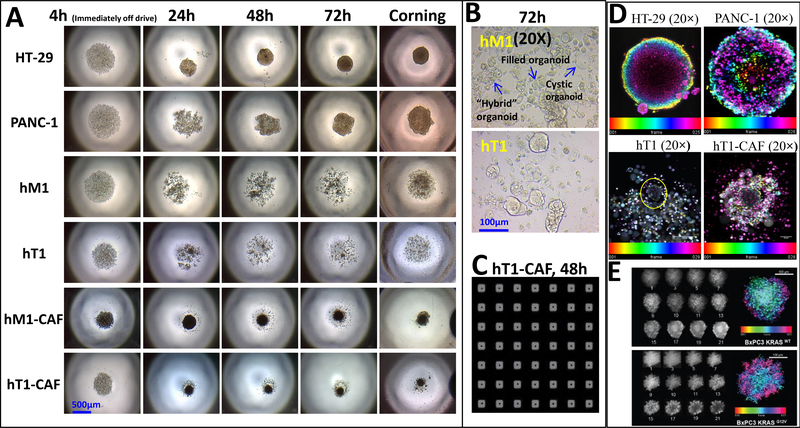
Figure 6. A panel of pancreatic cancer-derived cells was evaluated for their ability to form 3D structure using n3D bioprinting technology.
(A) The 3D structure formation of primary pancreatic cancer cells (hT1 and hM1), their associated fibroblasts (hT1-CAF and hM1-CAF) and standard cell lines (HT-29 and PANC-1) was monitored using standard microscopy (4× objective) in a Greiner Bio-One 384-well cell-repellent flat-bottom plate. These cells were also cultured in 384 Corning U-bottom spheroid plate as a point of comparison. (B) Enlarged images of hM1 and hT1 3D culture using a 20× objective representing small organoid-like structures in primary pancreatic cancer culture. (C) A portion of the full 384-well plate image obtained using the Scripps HIAPI instrument is shown to demonstrate homogeneous hT1-CAF spheroids were formed in each well of a 384-well plate using bioprinting technology. (D) 3D morphology of primary pancreatic cancer hT1 cells, associated fibroblasts, hT1-CAF and standard cell lines (HT29 and PANC1) cultured using n3D bioprinting technology were imaged using INCell 6000 confocal microscopy. Z-stack images were obtained by nuclei staining with Hoechst, then 2 or 5 micron image slices with confocal microscopy and stacked using ImageJ software. HT-29 and PANC-1 spheroids were used as standards. Z-stack images confirmed 3D structure formation of primary pancreatic cancer cells and their associated fibroblasts. (E) Confirmation of spheroidicity of BxPC-3-KRASWT and BxPC-3-KRASG12V stable cell lines was performed by confocal imaging. Z-stack images were taken at 10um increments from the equator of Hoechst-stained spheroids of both cell lines on a GE IN Cell 6000 Analyzer (10 x objective). Maximum intensity projection along the z axis of the 12 individual planes aligned in Image J to generate an intensity projection biased by color scale are shown in both panels.

