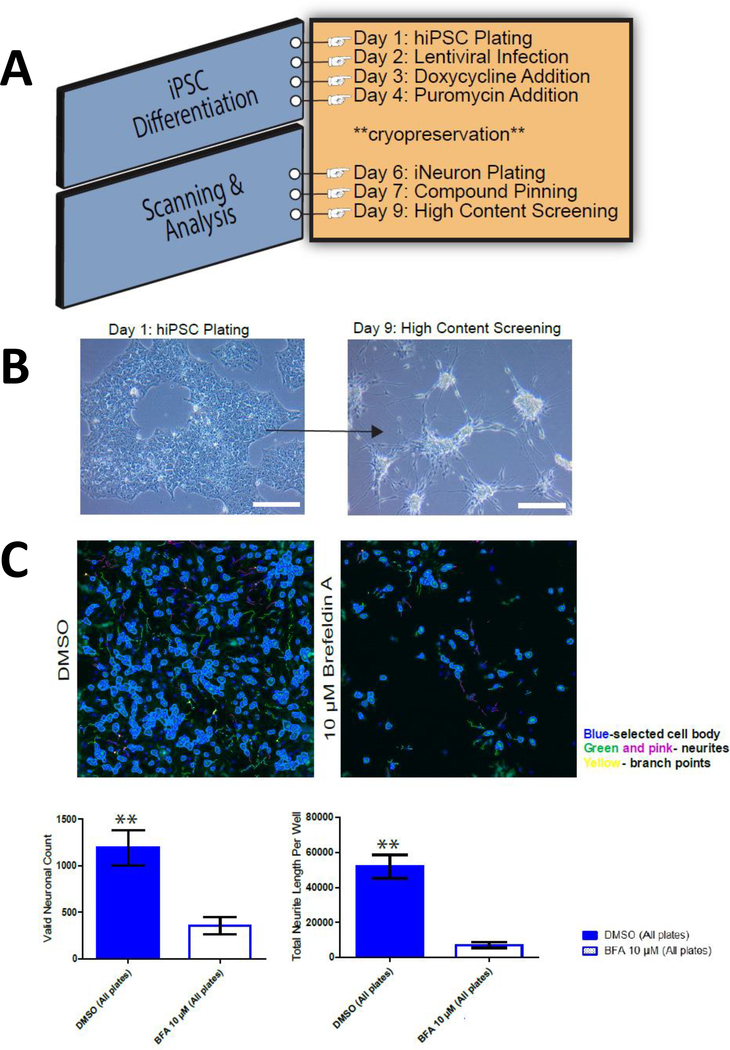
Figure 8.
(A) Schematic representation of NGN2 lentiviral-based neuronal induction starting from hiPSC to make glutamatergic neurons for use with HCS (B) Representative bright-field images of hiPSC differentiation to iNs at relevant time points. Day 1 was hiPSC plating and Day 9 denotes the end of screening time point. Scale bar = 100 μM. (C) Representative high content image processing of Day 9 iNs where neurites were traced according to predefined optimized parameters under the neuronal profiling module of Thermo's Cellomics ® software.

