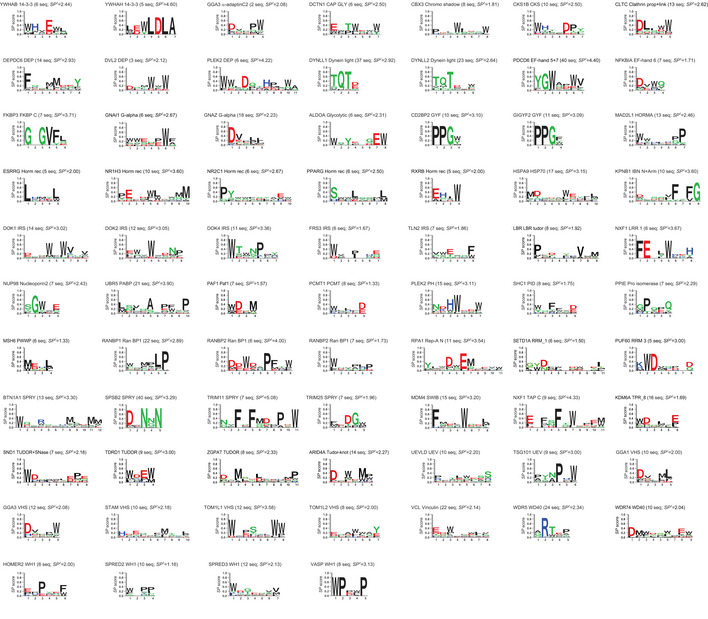
Figure 1. Specificity profiles for PRMs.

The specificity profiles for 74 PRMs are represented as logos showing the preferences at each peptide position. The following information is provided above each logo: name of the protein from which the PRM was derived, PRM family name, number of peptide sequences used to derive the logo (seq), and total specificity potential score (SPt) for the logo. Logos are presented in alphabetical order by family.
