
Figure 5.
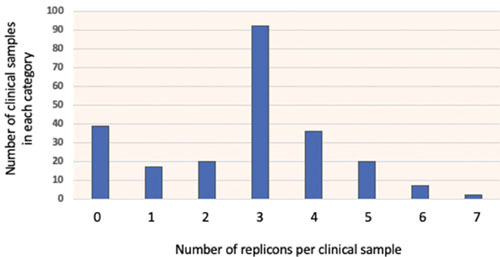
The distribution of replicon number per clinical sample is shown as a bar graph. The average number of replicons for samples that have at least one plasmid is 3.26. If all IncF replicons are considered as a single category, the average number goes down to 1.2.