. 2020 Dec 9;128(12):127001. doi: 10.1289/EHP7313

Figure 3.

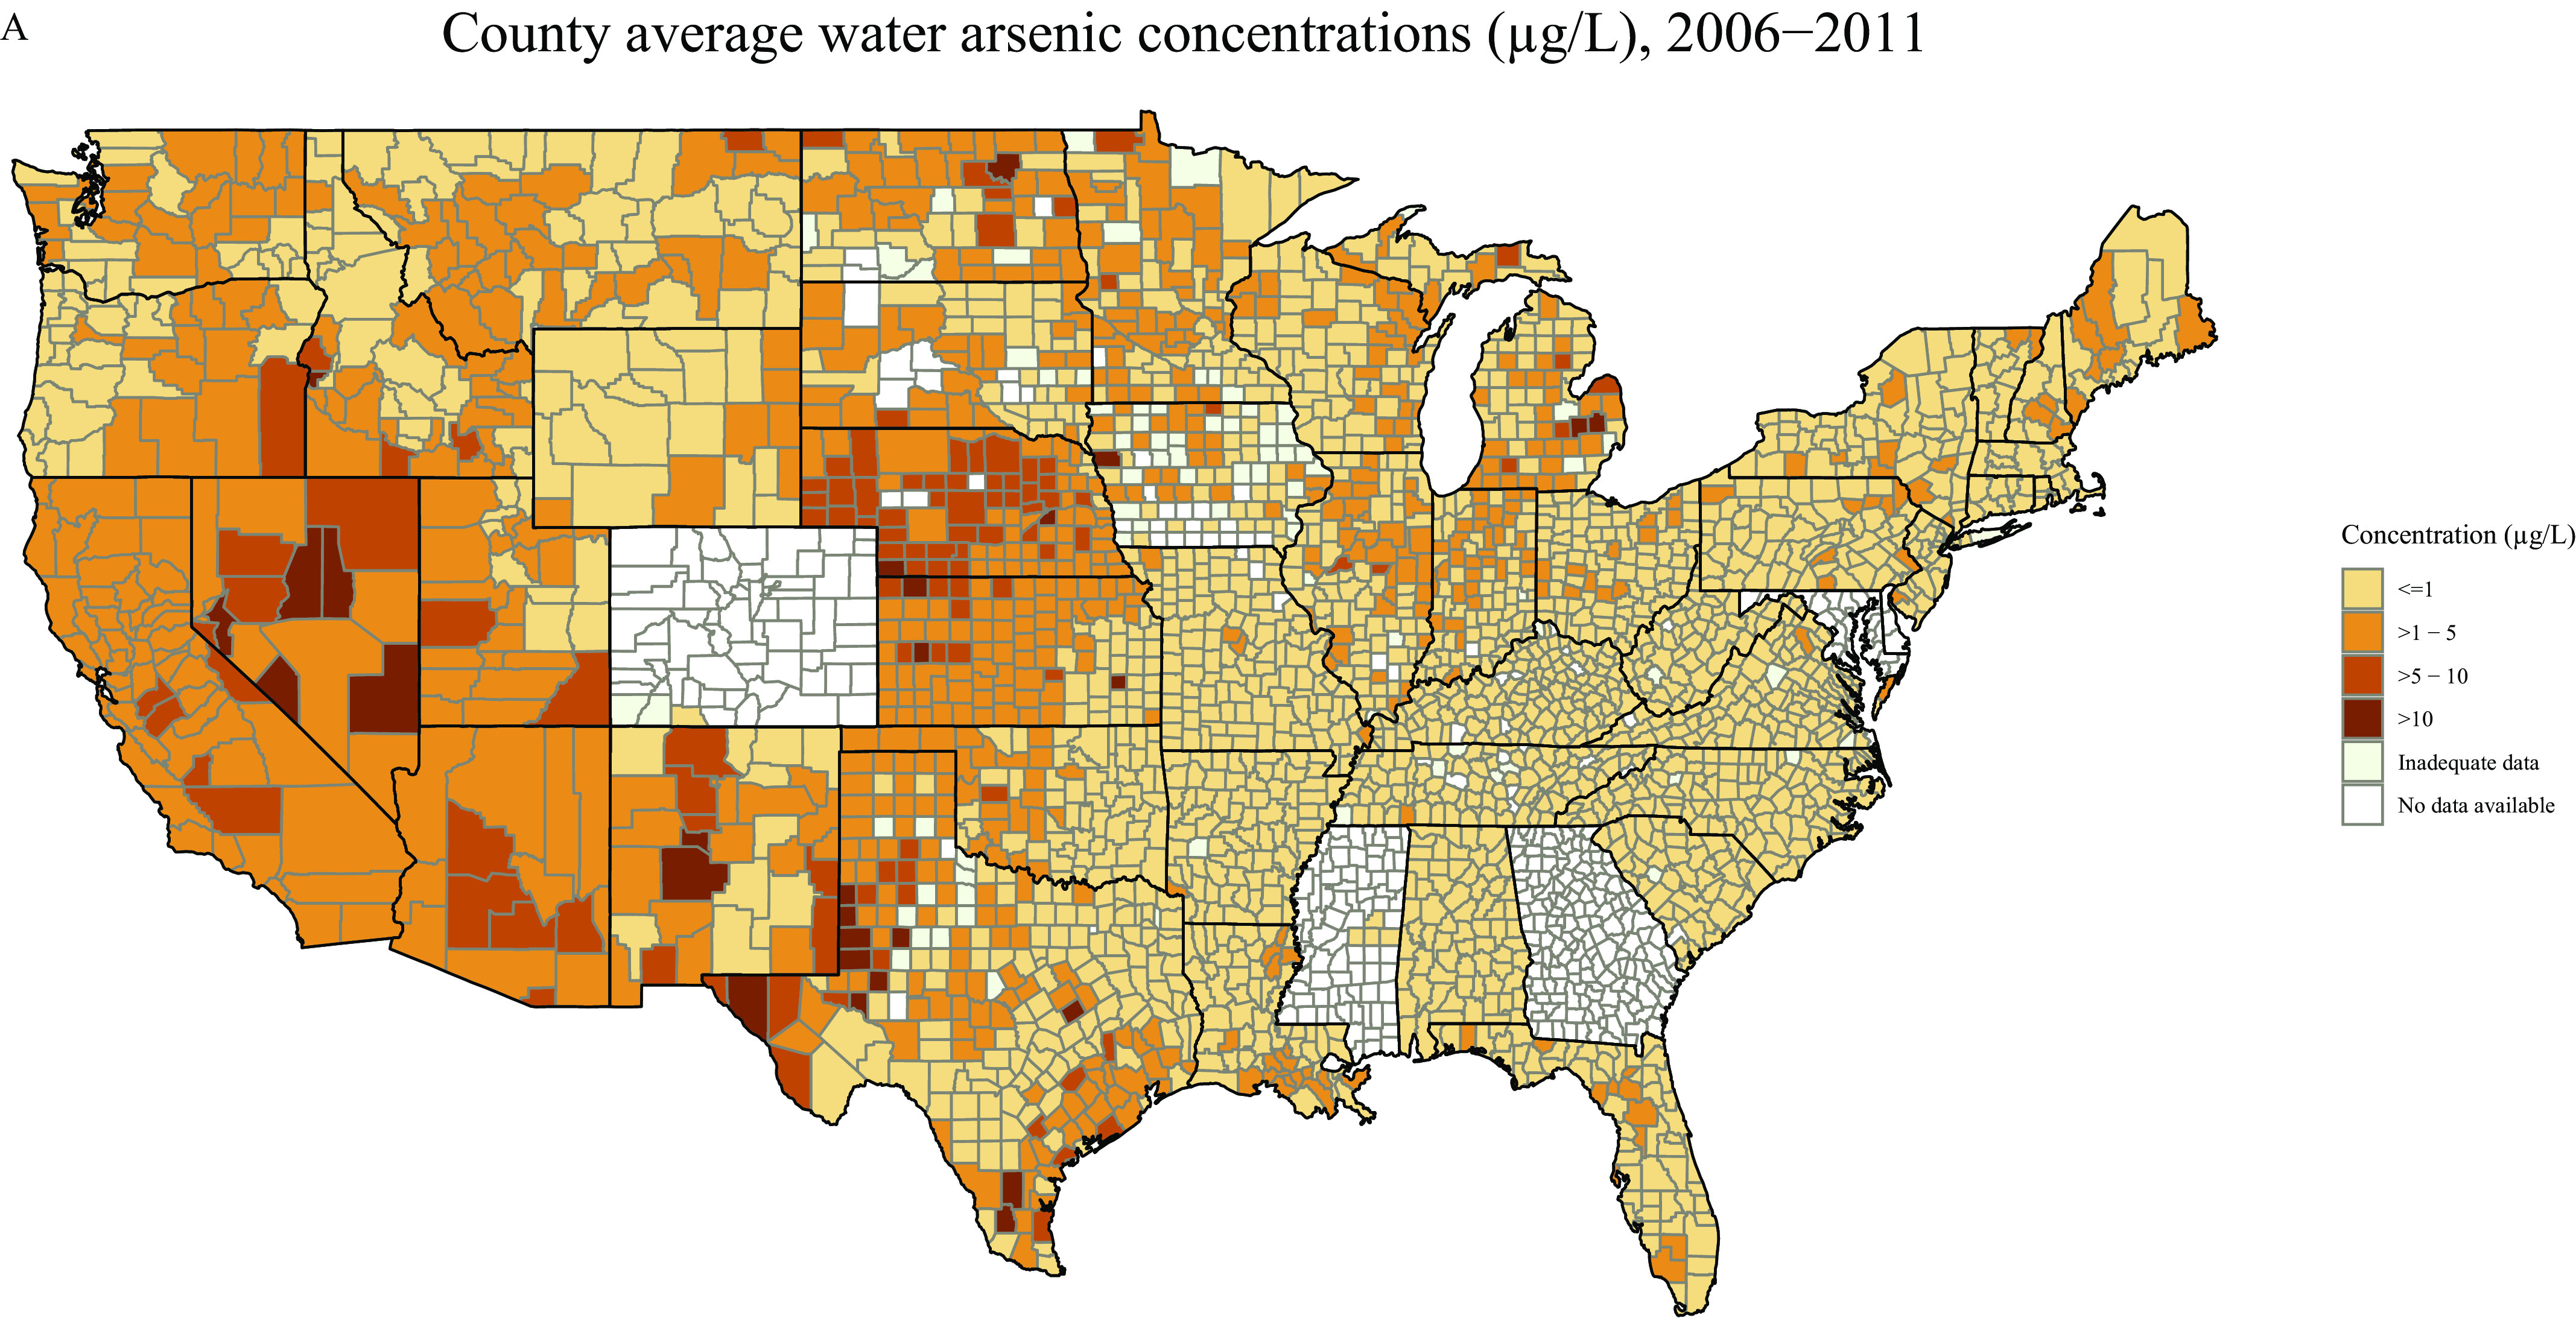
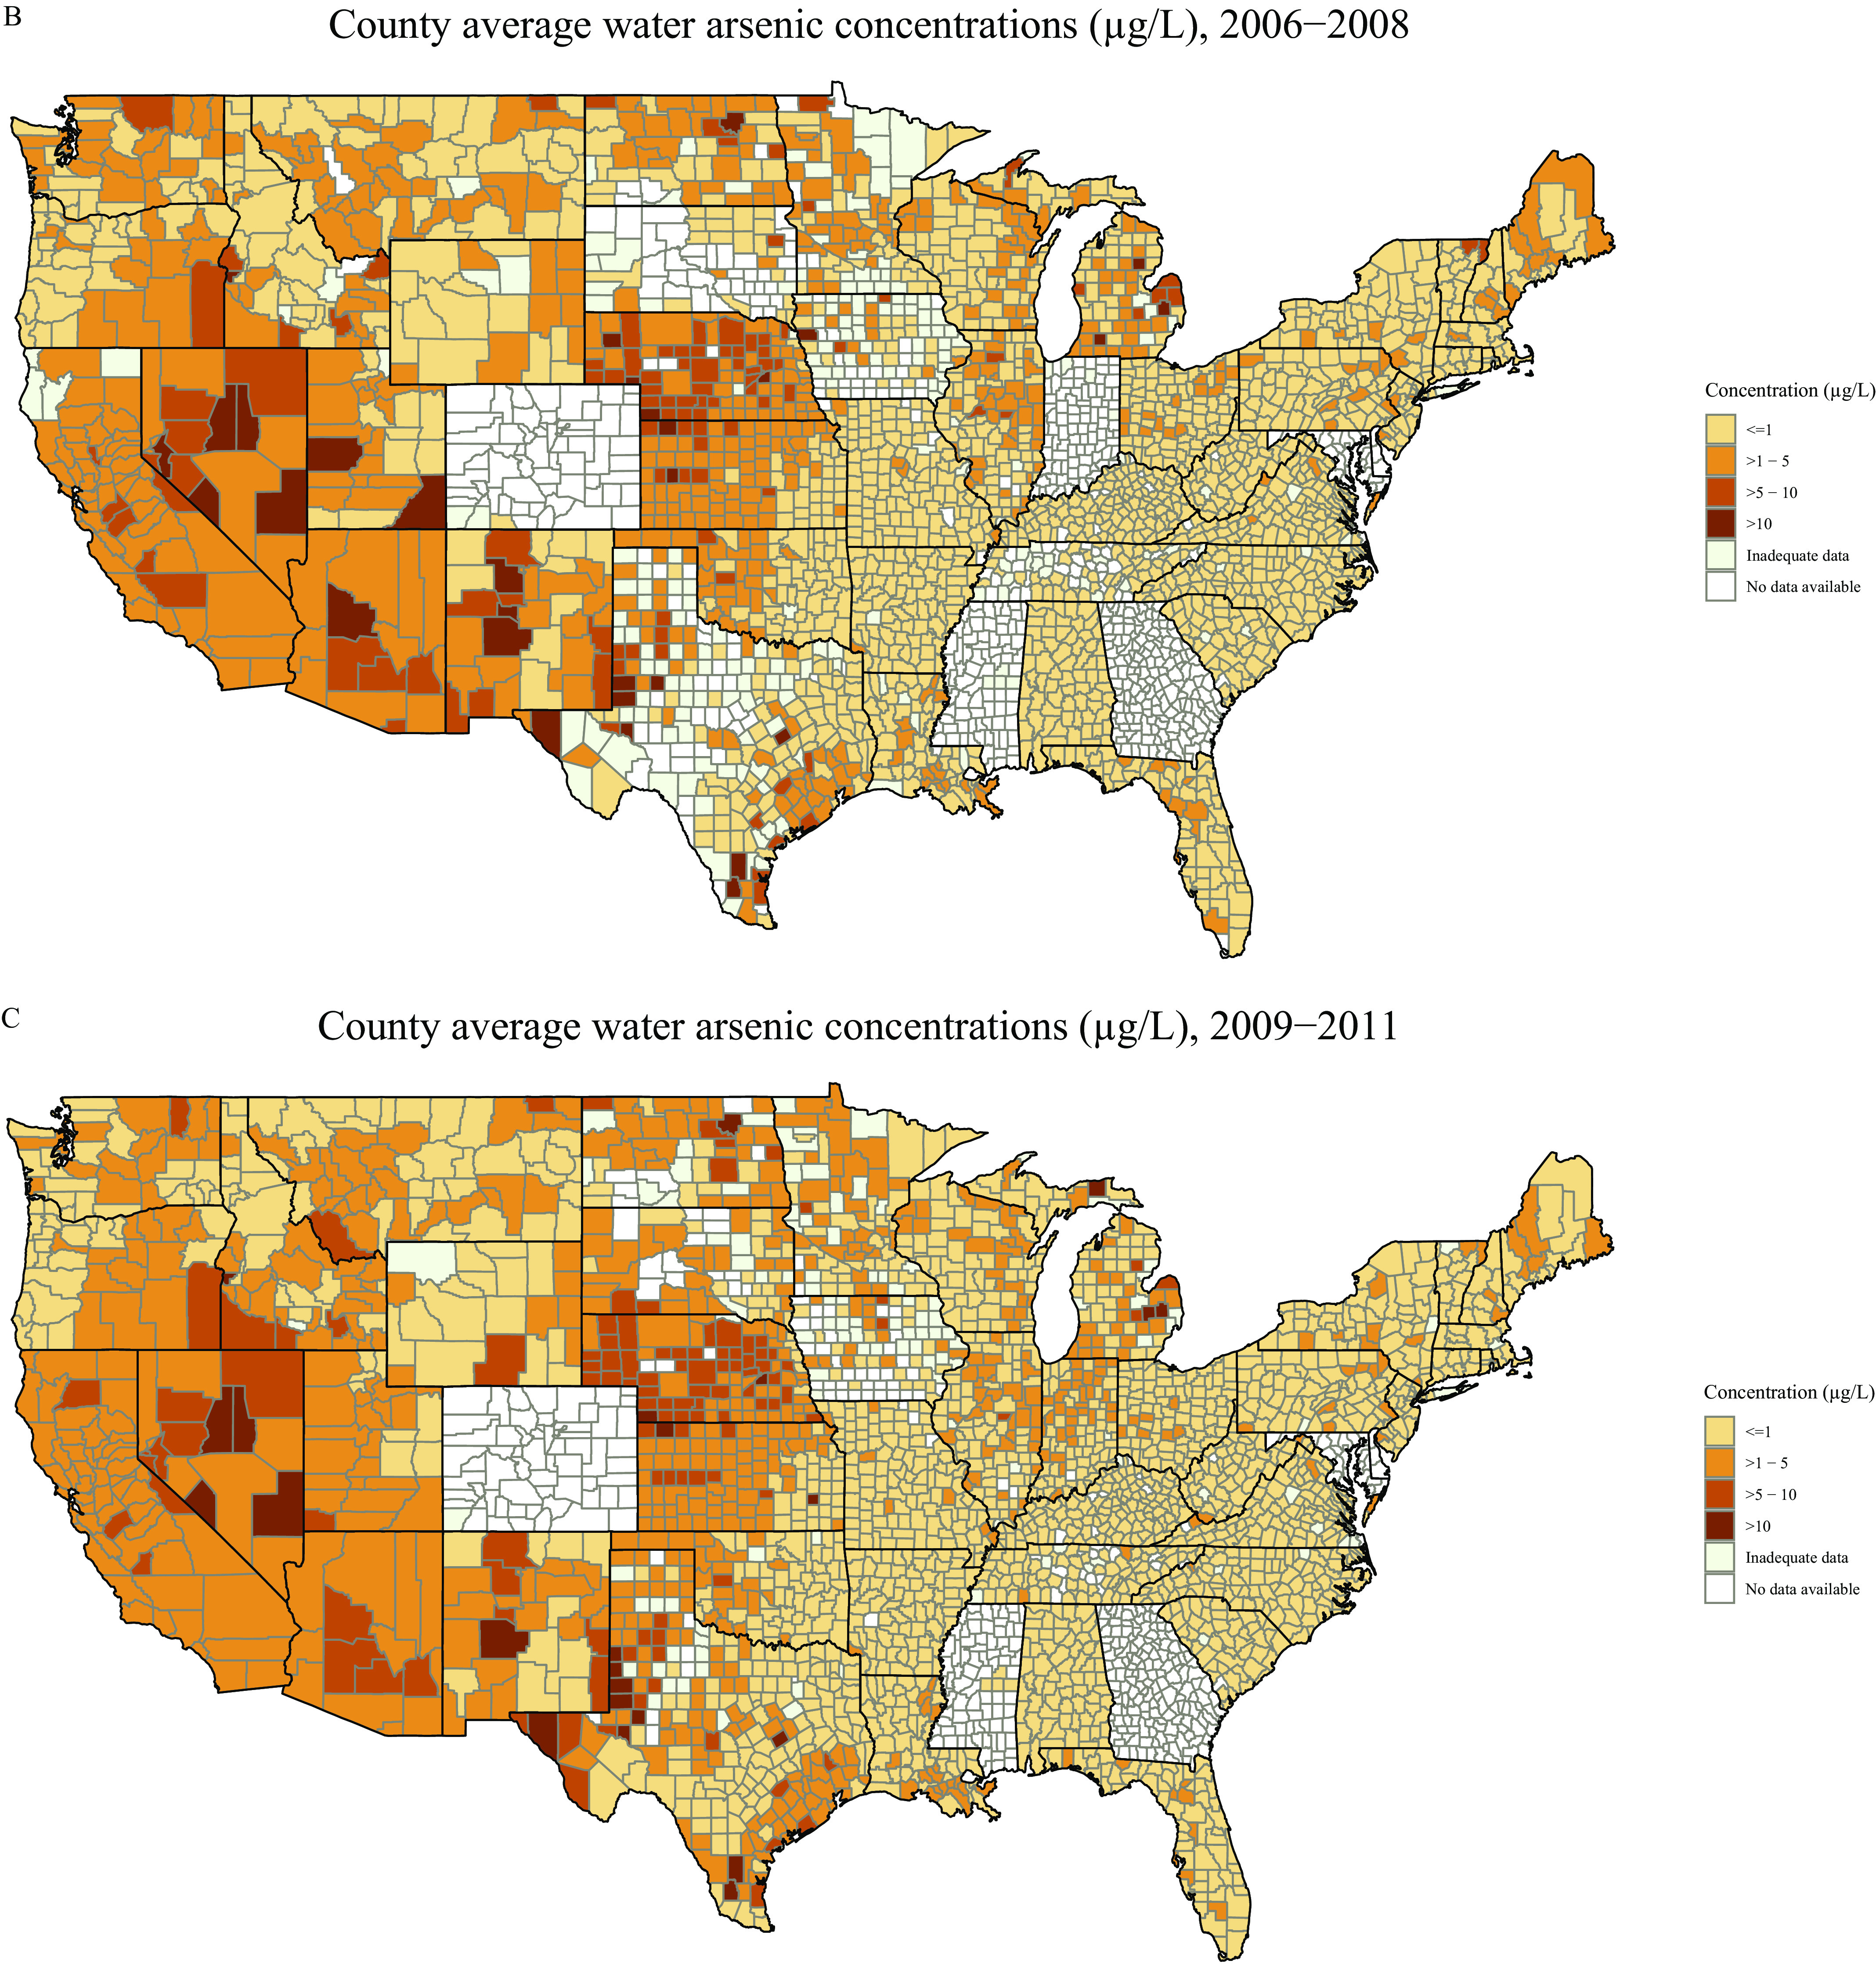
Figures 3A, 3B, and 3C are maps of the United States, depicting water arsenic concentrations in community water systems through estimated weighted average in county level from 2006 to 2011 (Figure 3A), 2006 to 2008 (Figure 3B), and 2009 to 2011 (Figure 3C) and plotting concentration (micrograms per liter), divided into six categories, namely, less than or equal to 1, greater than 1 to 5, greater than 5 to 10, greater than 10, inadequate data, and no data available.

Figures 3A, 3B, and 3C are maps of the United States, depicting water arsenic concentrations in community water systems through estimated weighted average in county level from 2006 to 2011 (Figure 3A), 2006 to 2008 (Figure 3B), and 2009 to 2011 (Figure 3C) and plotting concentration (micrograms per liter), divided into six categories, namely, less than or equal to 1, greater than 1 to 5, greater than 5 to 10, greater than 10, inadequate data, and no data available.

County-level estimated weighted average water arsenic concentrations in community water systems (CWSs) from (A) 2006–2011, (B) 2006–2008, and (C) 2009–2011 (N=36,406 CWSs serving N=2,740 counties). Average arsenic concentrations from 2006–2011 are the averages of both 3-y time periods (2006–2008 and 2009–2011). CWS arsenic concentrations were weighted by the population served by each system to estimate the county-level weighted average CWS arsenic concentrations. Counties that were not represented by any CWSs in the SYR3 database are labeled as “No data available.” Counties with “Inadequate data” did not have CWS data representing at least 50% of the public water–reliant population for either time period (2006–2008 and 2009–2011). SYR, Six-Year Review.