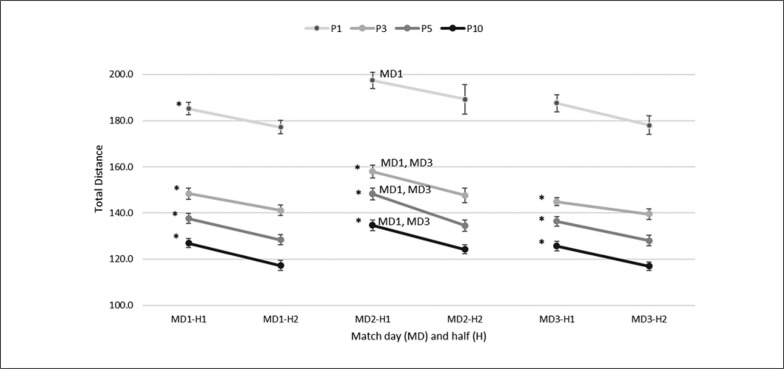
FIG. 1.
Total distance covered per minute in individual analyses for the four different periods (P1, P3, P5 and P10 are 1, 3, 5 and 10 minutes of rolling average) across the halves (H1 is first half and H2 is second half) during three consecutive matches (MD1, MD2 and MD3) over eight days. * is > H2, MD1 is > MD1 and MD3 is > MD3.

