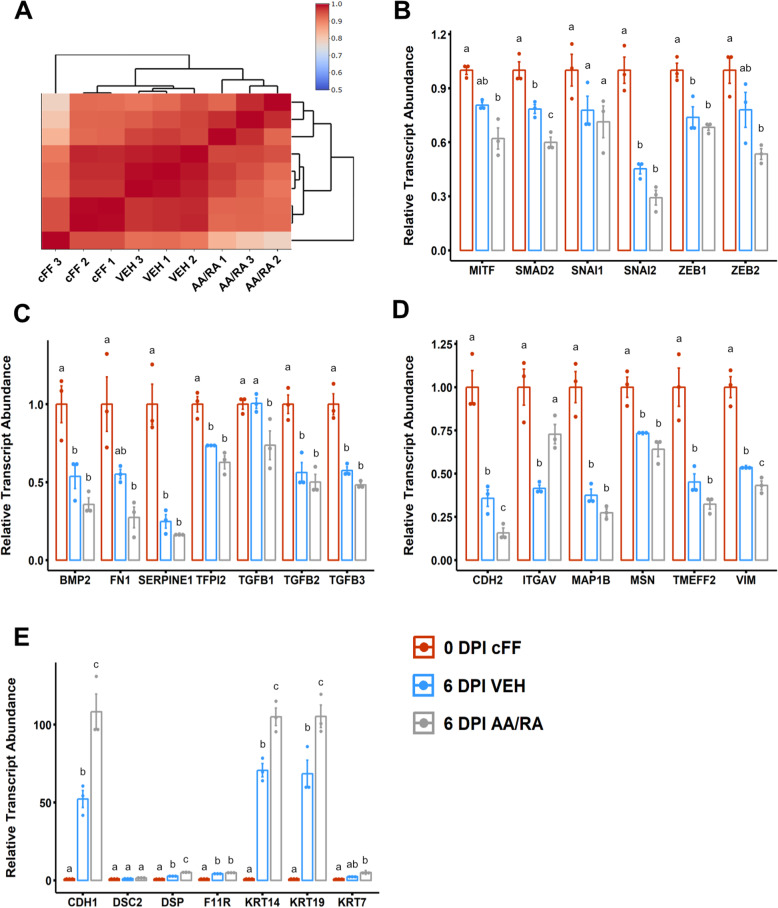
Fig. 3.
L-ascorbic acid and retinoic acid enhance a transcriptional response resembling mesenchymal-to-epithelial transition. a Heatmap of Pearson correlation coefficients of transcript panel abundances in each sample and grouped by hierarchical clustering. b Relative abundances of transcripts associated with regulation of gene expression. c Relative abundances of transcripts associated with secreted ligands or matrix components. d Relative abundances of transcripts associated with the cytoskeleton or cell adhesion that are downregulated at 6 DPI. e Relative abundances of transcripts associated with the cytoskeleton or cell adhesion that are upregulated at 6 DPI. Data are presented as mean ± standard error, n = 3. Means annotated with different letters are considered significantly different by one-way analysis of variance and Tukey’s honestly squared difference test, P < 0.05

