Fig. 4.
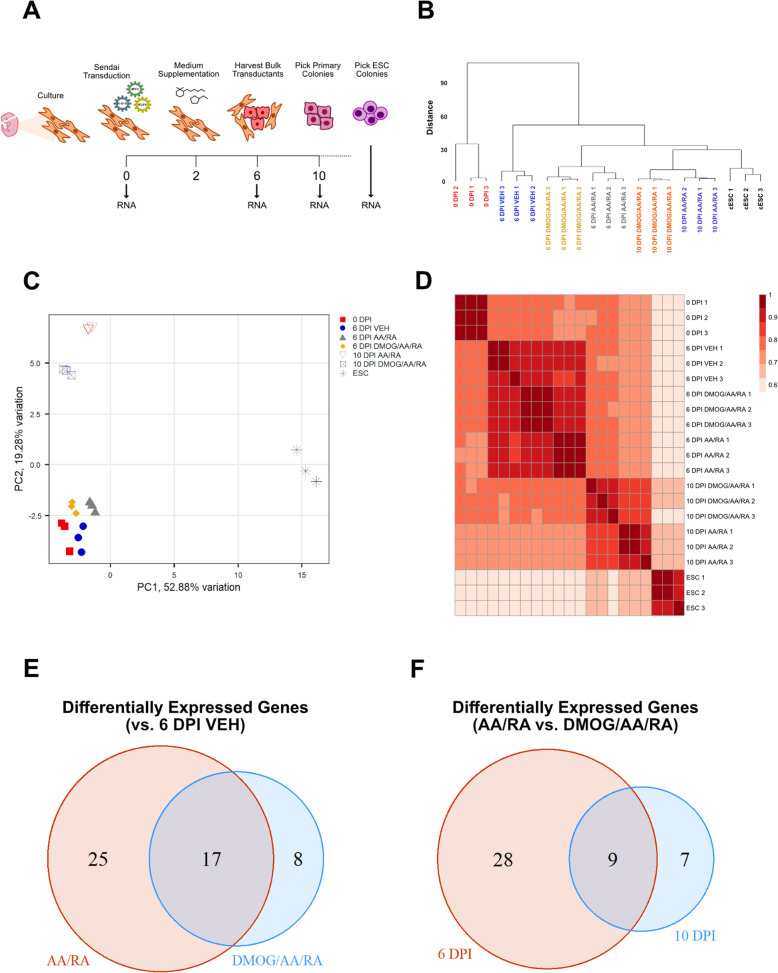
Exploratory data analysis and summarization of differential gene expression for targeted expression profiles of canine reprogramming intermediates. a Schematic of canine fetal fibroblast (cFF) reprogramming and timepoints of RNA sample collection. b Hierarchical clustering analysis of all samples based on gene expression. c Principal component analysis of all samples based on gene expression. d Correlation heatmap of all samples based on gene expression. Sequential color scale represents Kendall’s rank correlation coefficient. e Venn diagram showing the number of differentially expressed genes versus the 6 DPI vehicle (VEH) group for 6 DPI AA/RA (red) and 6 DPI DMOG/AA/RA (blue). f Venn diagram showing the number of differentially expressed genes for AA/RA versus the corresponding DMOG/AA/RA group at 6 DPI (red) and 10 DPI (blue)

