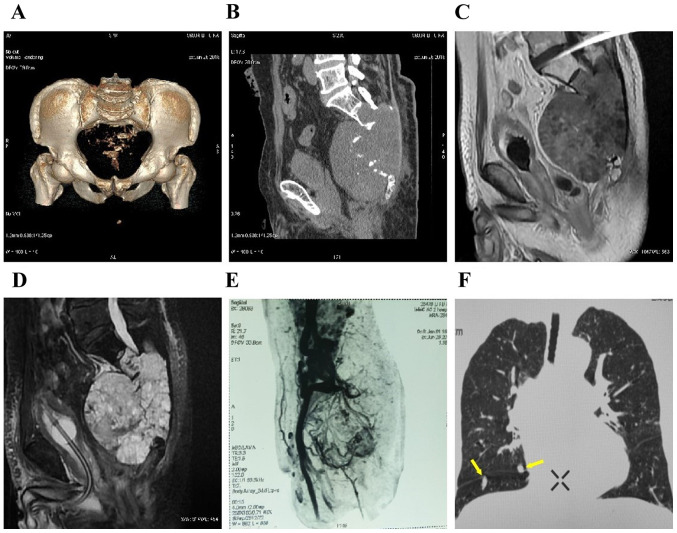
Figure 2.
(A-D) Computed tomography scan and magnetic resonance imaging showing bone dissolution and destruction below the S2 level, and a 14x13x12.6-cm round soft tissue mass with a clear boundary and irregular spot-like calcification. (E) Pelvic angiography revealed abundant blood supply to the tumor. (F) Computed tomography scan of both lungs showing multiple dense pulmonary metastases with a smooth border, with a maximum diameter of ~0.95 cm (arrows).

