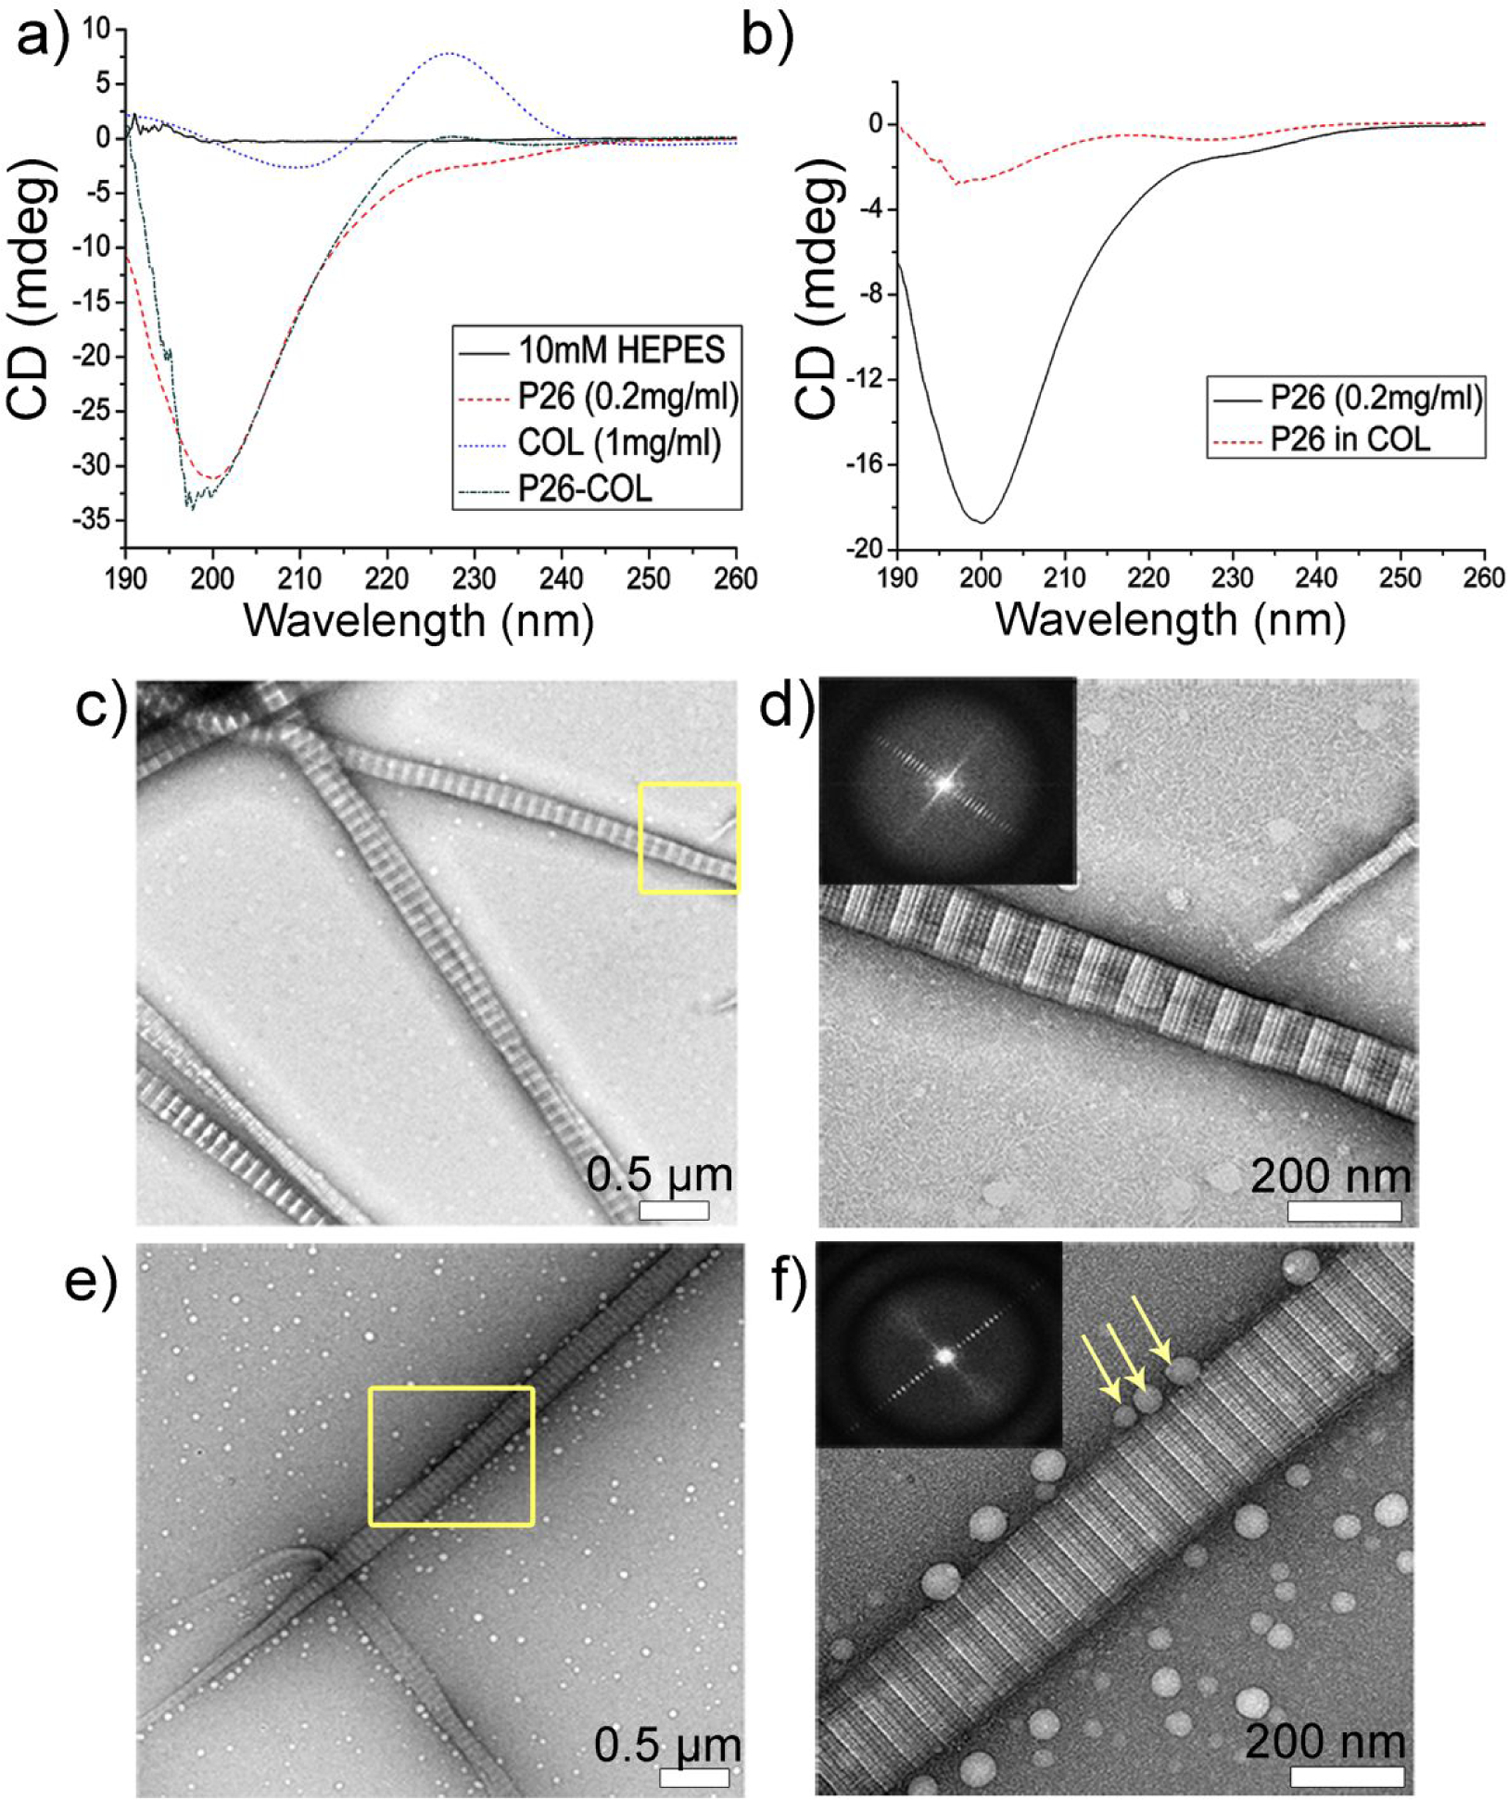
Figure 1.

Collagen-P26 interaction and assembly. (a) Circular dichroism (CD) spectra of collagen, P26 and collagen/P26 mixture after incubation at 25 C and at pH 7.15. (b) The normalized secondary structural changes in P26 after mixing with collagen compared to P26 alone. (c) and (d) Negatively stained TEM images of collagen self-assembly to fibrils in PBS after incubation at 25 C for 2 h at low and high magnification respectively. (e) and (f) Negatively stained TEM images of P26-collagen self-assembly in PBS after incubation at 25 C for 2 h at low and high magnification respectively. The insets in d and f are the Fourier Transform data showing the d-spacing of collagen fibrils (~67 nm). Peptide P26 assembly can be seen as dispersed nanospheres aligned closely along the collagen fibril (yellow arrows in f).
