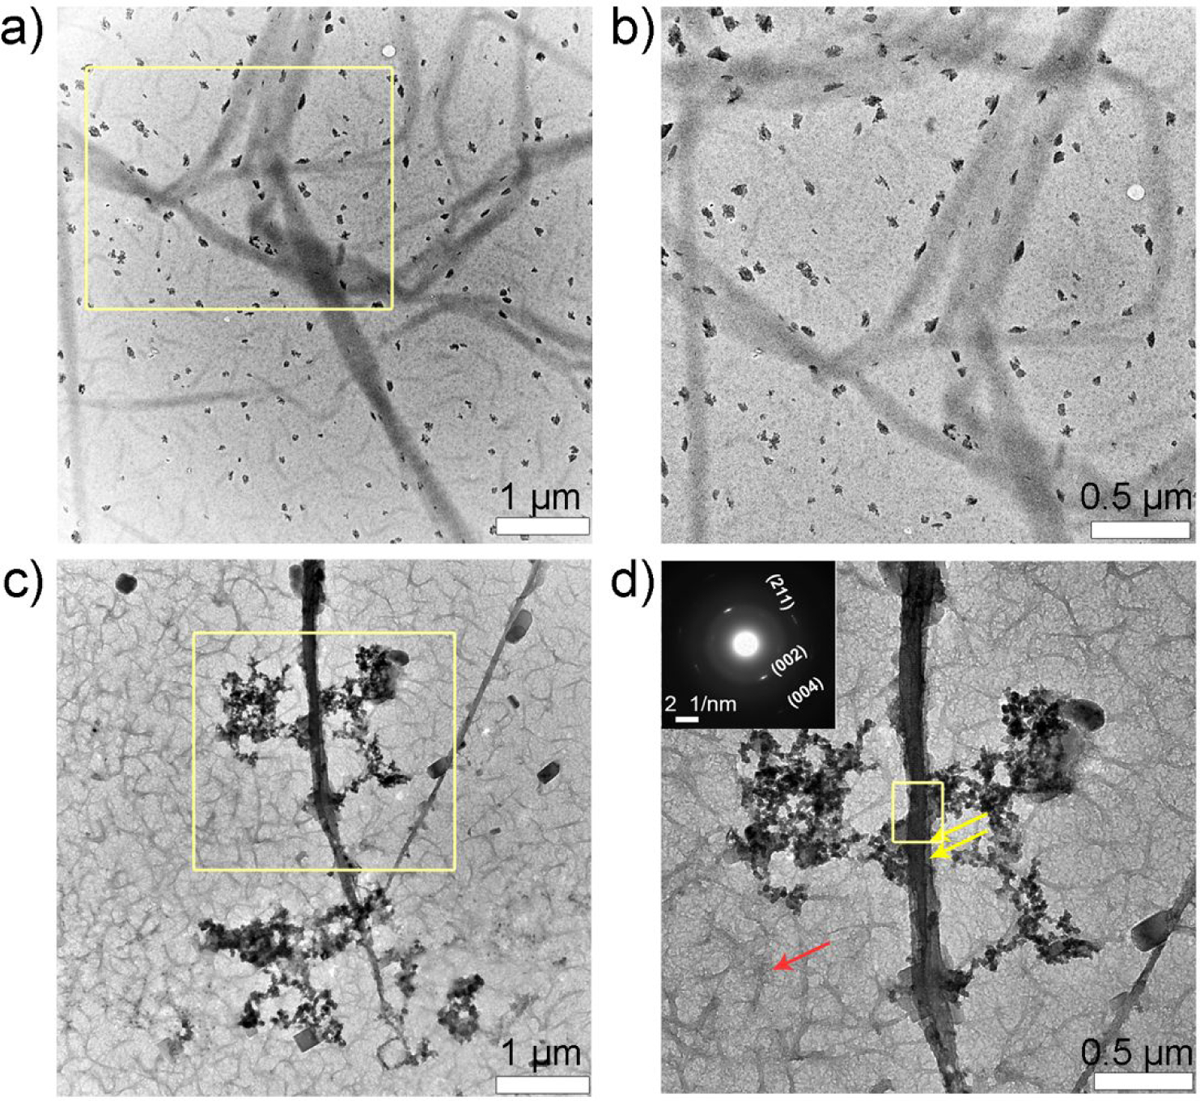
Figure 3.

Collagen-P26 mineralization after 2.5 hours. Unstained TEM images of collagen mineralization in vitro for 2.5 h in the control sample (no P26) at (a) low and its corresponding (b) high resolution of yellow square in (a). There are randomly scattered larger-sized mineral aggregates seen on the grid surface. TEM images of collagen mineralization in vitro for 2.5 h in the presence of P26 at (c) low and its corresponding (d) high resolution of yellow square in (c). Electron-dense fibrils can be seen on the grid surface along with formation of mineral deposits (yellow arrows in d). Selected-area electron diffraction data of fibril taken from (d) in inset indicates the presence of mature apatite crystals on collagen fibril. Yellow box in (d) indicates the area where SAED was recorded.
