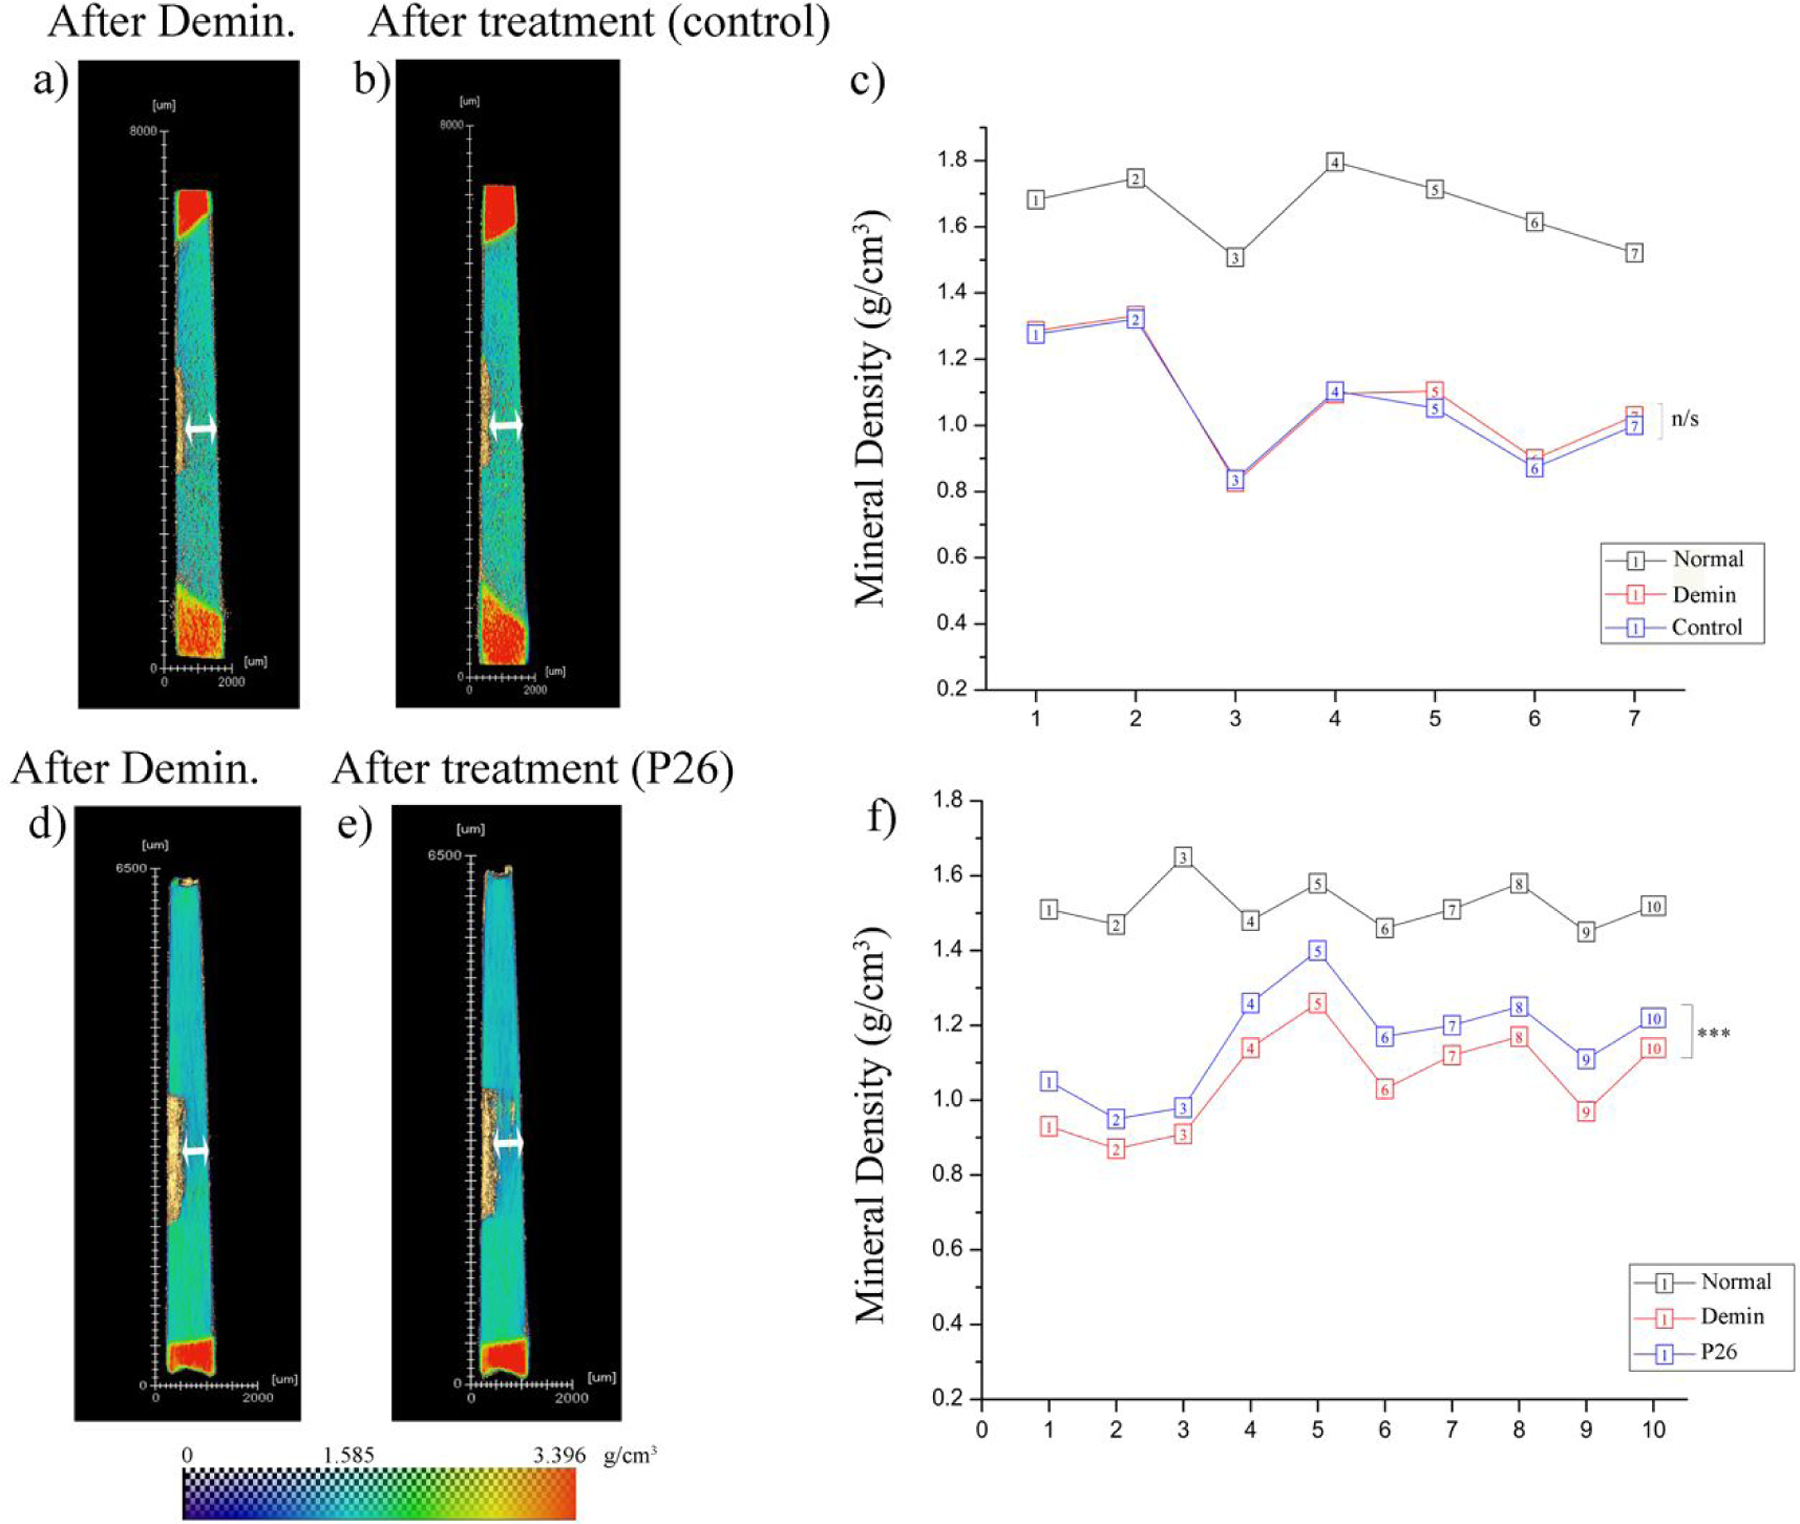
Figure 6.

Micro-CT analysis of demineralized dentin before and after remineralization. Heatmap images of transverse dentin discs showing (a) demineralized and (b) control dentin (turquoise), surrounded by tooth enamel at ends (red). Experimentally obtained MD values of sound enamel and dentin were used for calibration of heatmap color scale. There is no discernible change in lesion depth in the control sample following 10 days of incubation in artificial saliva. (c) Individual data points representing MD (mineral density) sample wise for normal, demineralized and control dentin (n=7). There is no change in MD between the demineralized and control groups. (d, e) Heatmap images of transverse dentin discs showing (d) demineralized and P26-treated dentin. There is a visible decrease in lesion depth in the peptide treated sample following 10 days of incubation in artificial saliva. (f) Individual data points representing MD values sample wise for normal, demineralized and P26-treated dentin (n=10). The gain in MD after peptide application is statistically significant (p < 0.001). Note: (n/s: non-significant difference).
