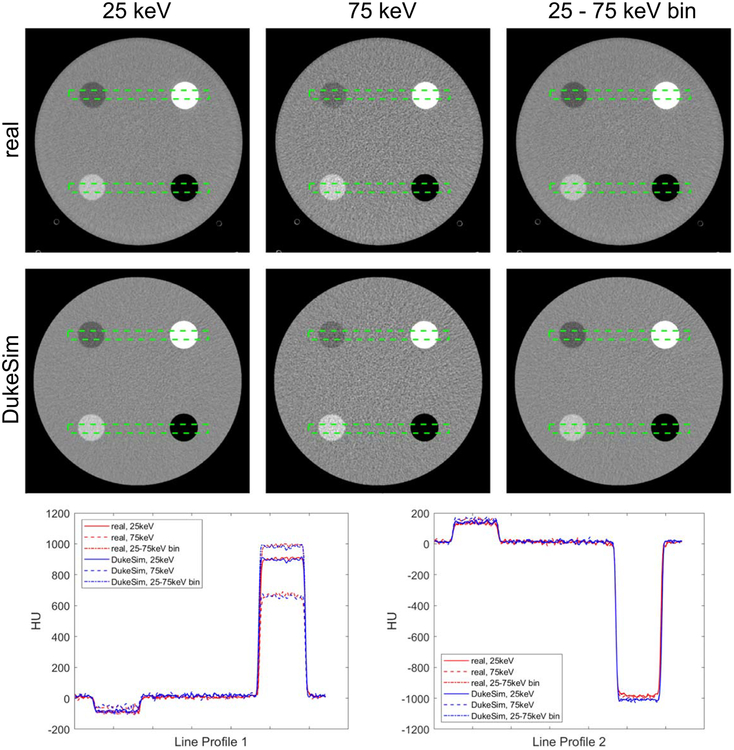
Figure 3.
The real and simulated PCD images at 25 keV, 75 keV, and the bin between 25 and 75 keV. Two line profiles are shown comparing the intensity values. The images are shown with a window of 600 and level of 0 Hounsfield Units (HU), HU values were calculated setting the mass attenuation coefficient of water to be 0.0172 mm2 g−1.

