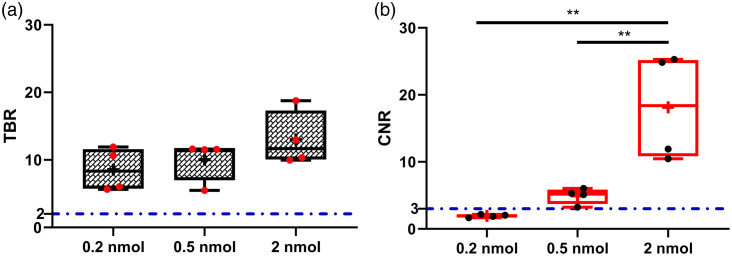
Fig. 4.
Tumor contrast as a function of -MMC(IR800)-TOC dose. Mice with HCT116-SSTR2 tumors were intravenously injected with 0.2, 0.5, or 2 nmol of drug. 24-h post-injection mice were sacrificed and tumor, muscle were excised and imaged with the OnLume imager to determine (a) TBR and (b) CNR. The dashed-dotted blue lines in (a) and (b) represent the commonly used threshold for TBR and the Rose criterion, respectively. The box plot extends from the 25th to 75th percentiles, the line in the middle indicates the median, the cross indicates the mean, and the whiskers extend from the minimum to the maximum value (). **, .

