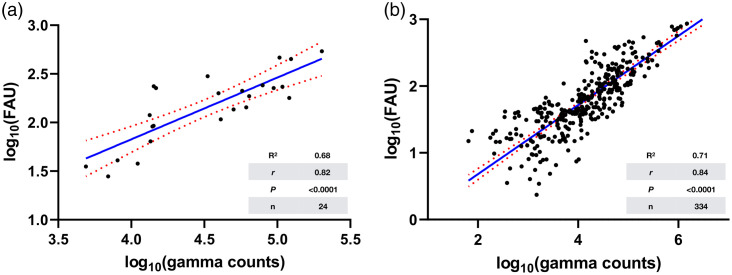
Fig. 8.
Relationship between the underlying drug distribution and the fluorescence acquired by the OnLume imager. Fitting of log-transformed linear regression models using gamma counts (drug only) and fluorescence arbitrary units (FAU; drug–device) in (a) tumors () and (b) all tissues () as independent and dependent variables, respectively.

