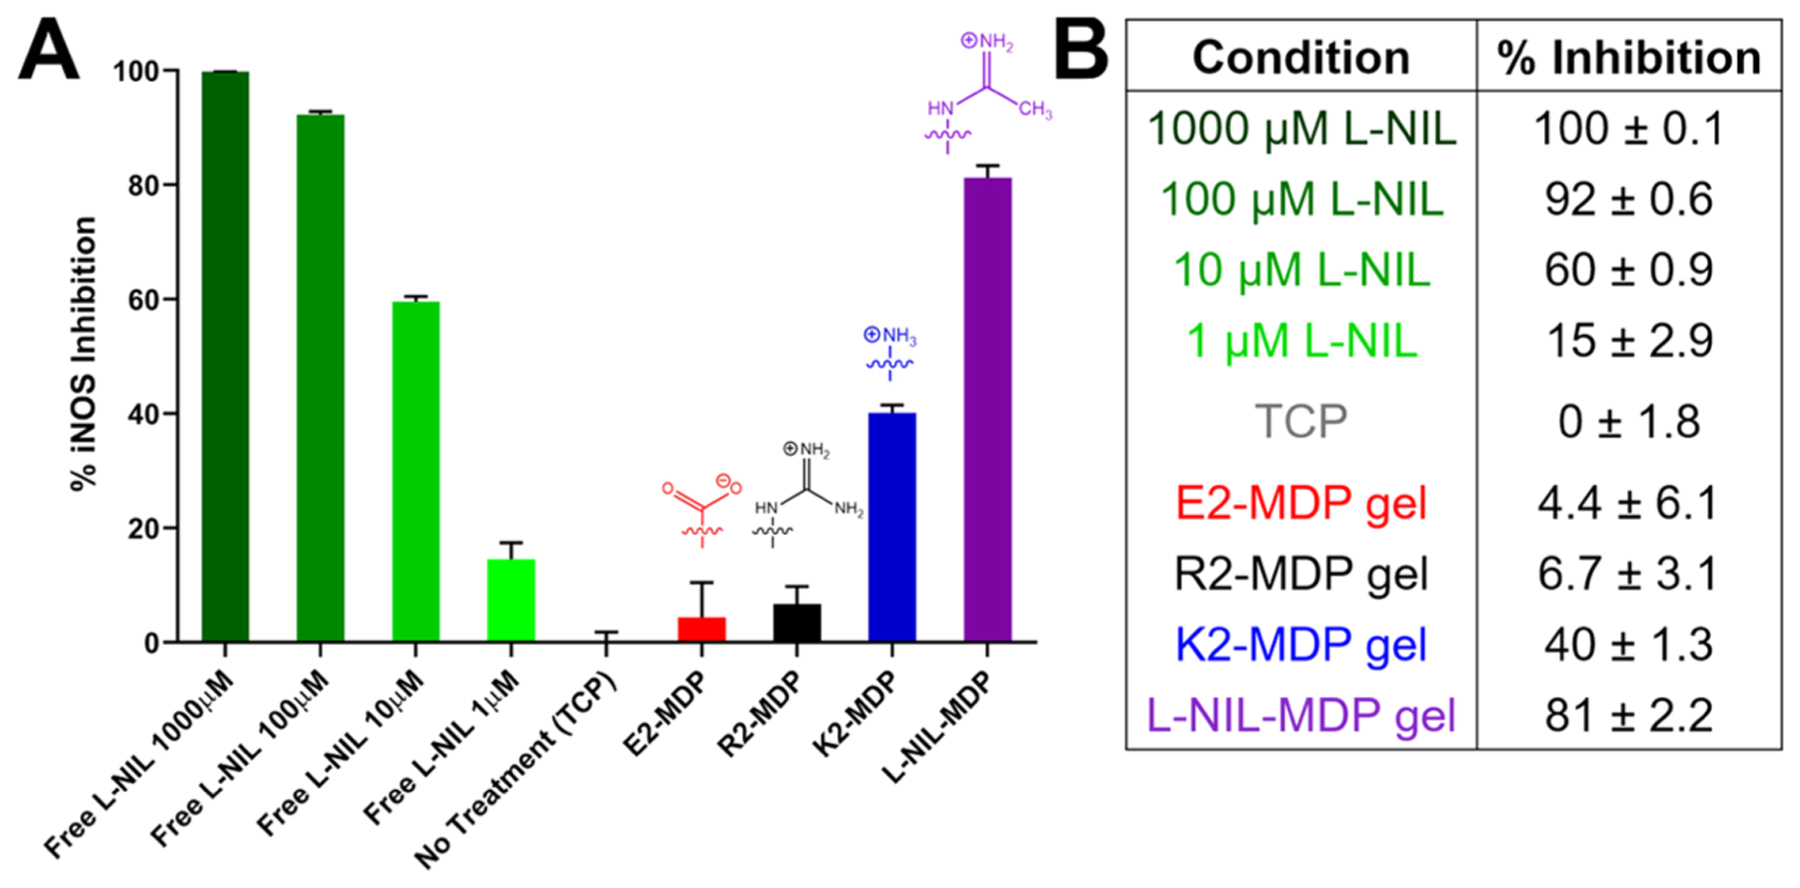
Figure 5.

Greiss assay results used to evaluate iNOS knockdown efficacy of various materials. (A) The plot of % iNOS inhibition of RAW 264.7 cells stimulated with lipopolysaccharide (LPS) and IFN-γ cultured in different surface conditions, showing chemical structures of key surface-exposed functional groups. Data have been normalized for cell viability on each hydrogel surface determined from the viability assay shown in Figure 4. (B) Quantification of relative inhibition activity; values are from two experiments and are mean ± SD with three replicates tested per condition.
