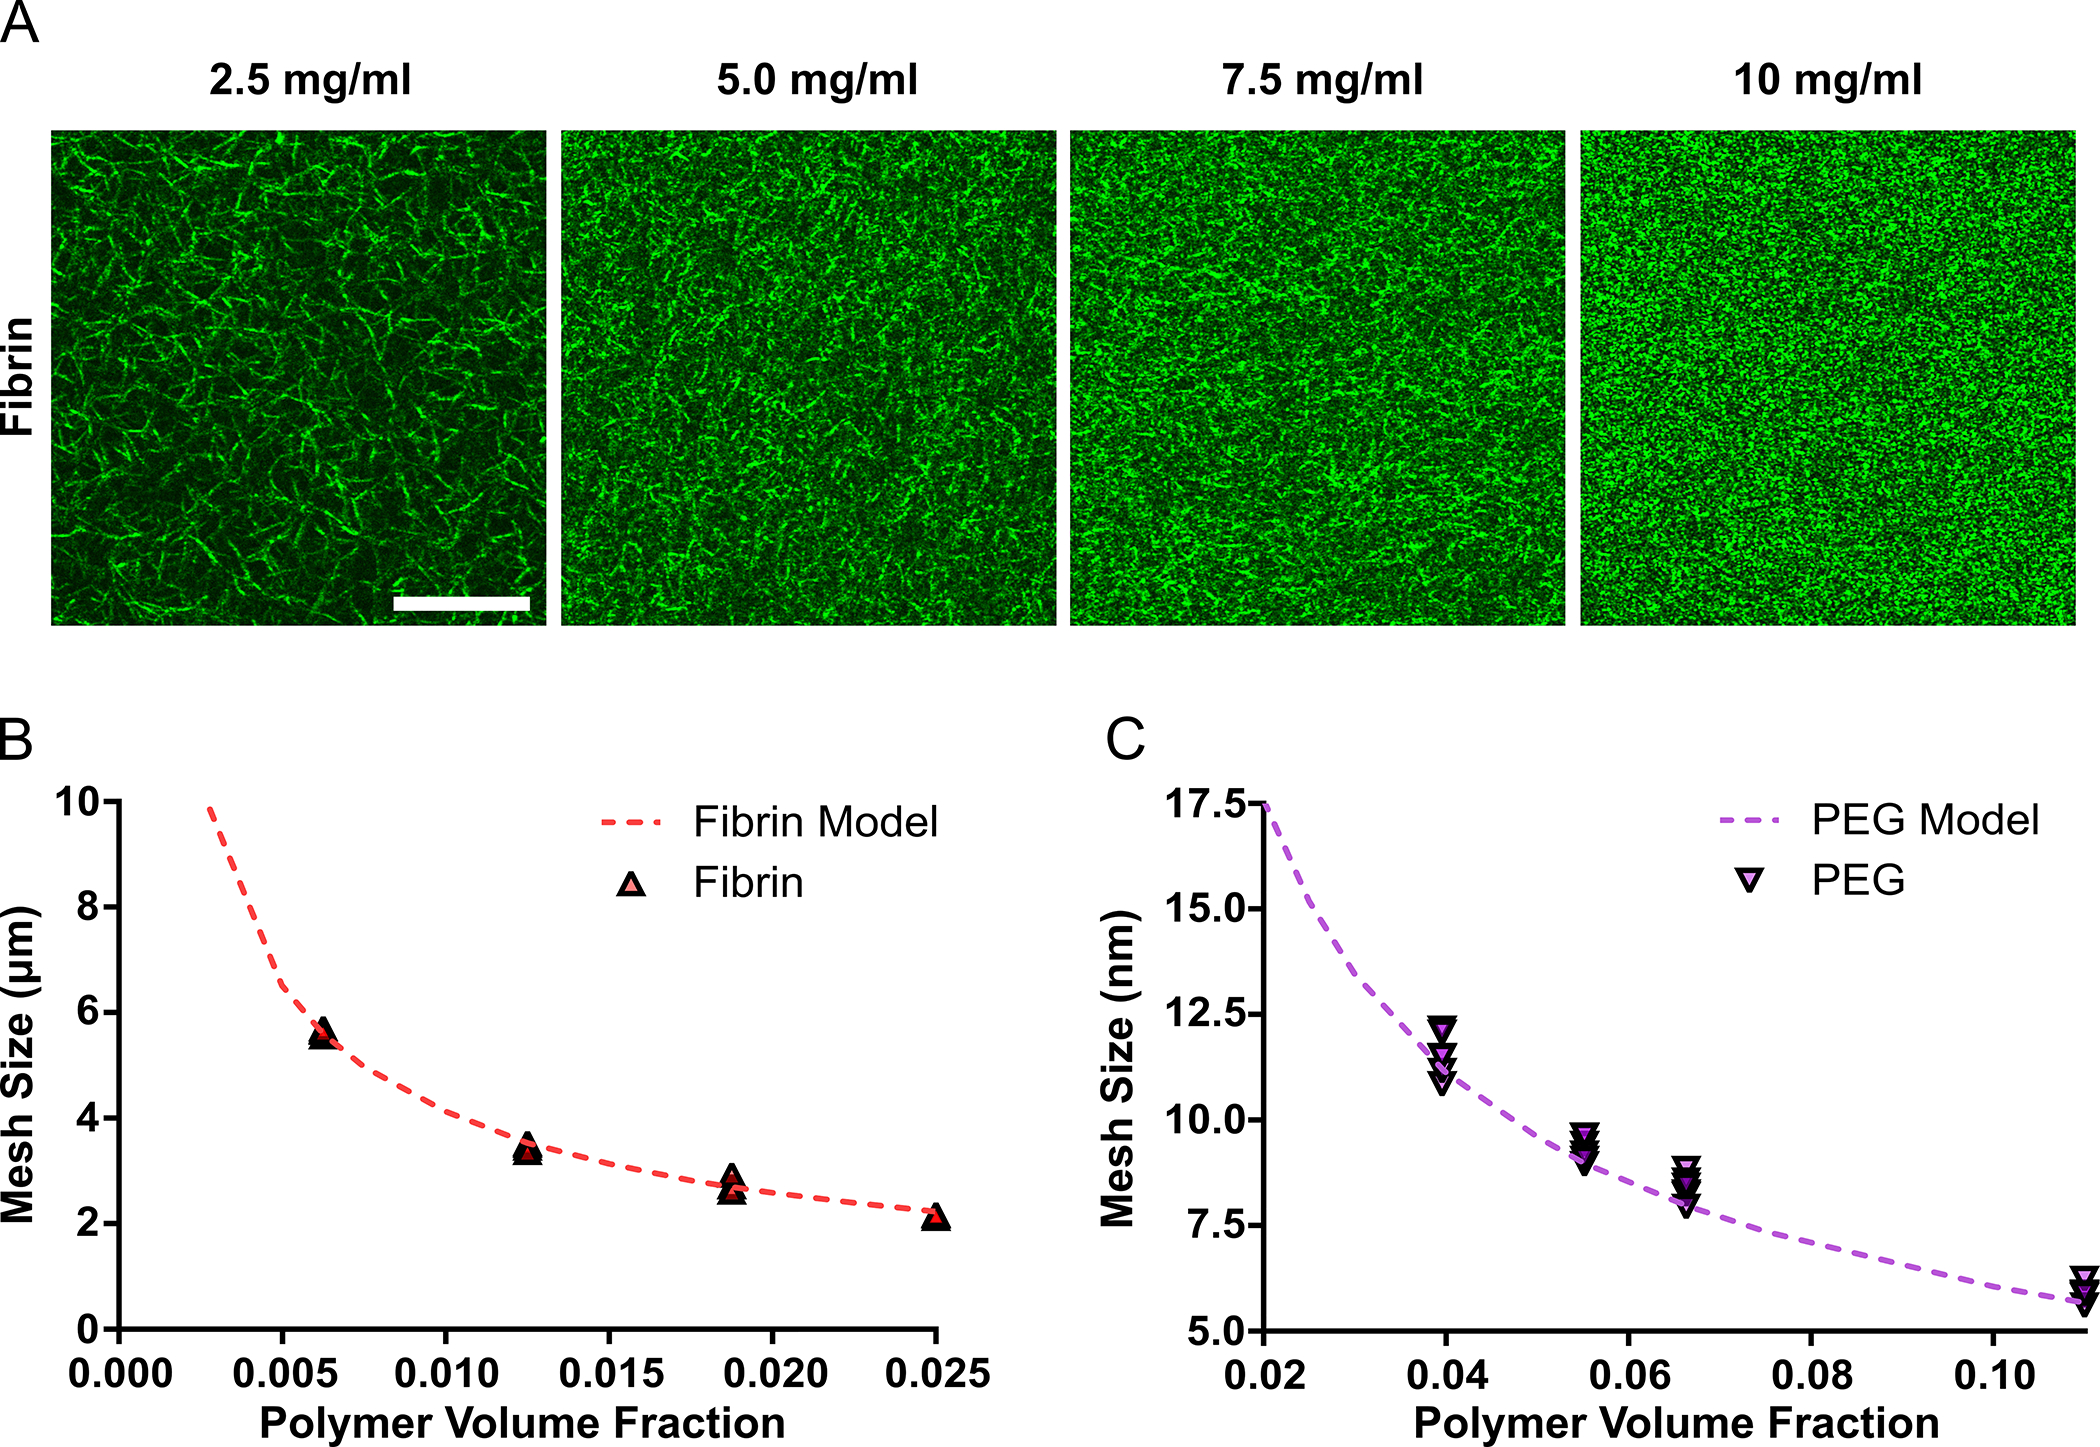
Fig 6. The Computational Model Simulated the Mesh Structure of Other Hydrogel Systems.

The computational-based strategy for determining hydrogel mesh size was further validated for fibrin and PEG hydrogels. Confocal reflection of the fibrin meshwork for 2.5, 5, 7.5 and 10 mg/ml hydrogels is provided. Scale bar represents 20 μm (A). The computational model provided a very close estimation of fibrin hydrogel mesh size determined from the confocal images (B). The mesh size of PEG hydrogels was accurately predicted by the simulations for varying PEG concentrations (C). In figure panel B and C, scatter dot plots display individual measurements and dashed lines represent mean values determined from the simulations (B–C, n = 4–6).
