
Figure 5. OCN/GPR158 Signaling in the CA3a Affects Pre-exposure-Mediated Contextual Fear Conditioning.
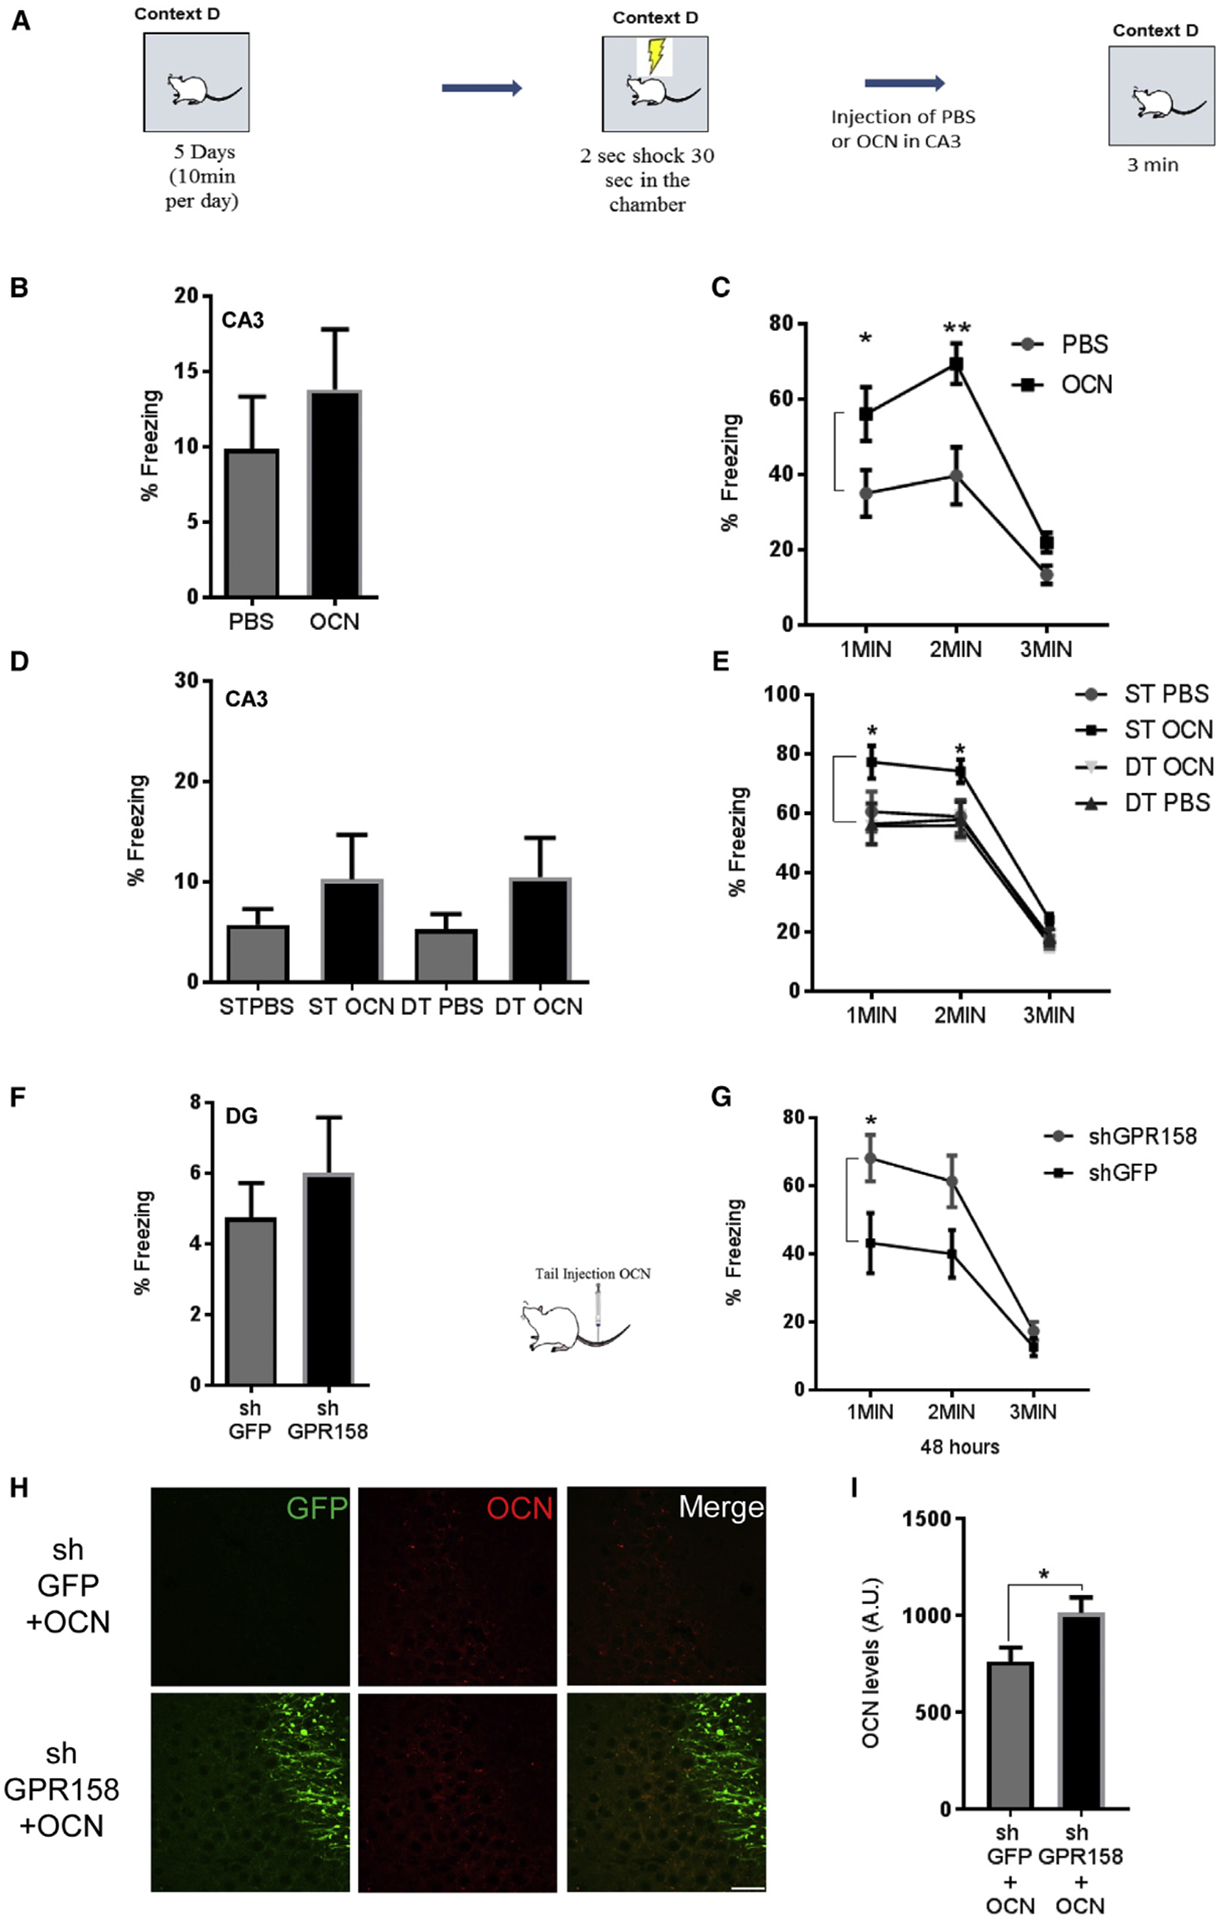
(A) Schematic of pre-exposure contextual fear conditioning.
(B) Freezing levels of mice injected with PBS or OCN 30 s after one 1.5-mA foot-shock.
(C) Freezing levels during 1–3 min of exposure to context D 48 hr after injection of OCN or PBS in CA3a. OCN enhances freezing after injection in CA3a (two-way RM ANOVA, post hoc Bonferroni; n = 10 mice per group; p = 0.0311 and p = 0.0013).
(D) Freezing levels of ST and DT mice injected with OCN or PBS in CA3a 30 s after one 1.5-mA foot-shock.
(E) Freezing levels of ST and DT mice 1–3 min during exposure to context D 48 hr after injection of OCN or PBS in CA3. OCN had an effect only in ST mice (two-way RM ANOVA for OCN versus PBS, Bonferroni post hoc, p = 0.0136 and p = 0.0295 for first minute and second minute comparison between ST OCN and ST PBS mice; three-way ANOVA for genotype x treatment effect, p = 0.0094; n = 12 mice).
(F) Freezing levels of shGFP and shGPR158 mice injected in DG/CA3c 30 s after one 1.5-mA foot-shock.
(G) Freezing levels of shGFP and shGPRI 58 mice in DG/CA3c during exposure to context D, 48 hr after tail injection of OCN. Tail injection of OCN in shGPRI 58 mice had an increase in freezing (two-way RM ANOVA, post hoc Bonferroni; treatment, p = 0.0409; n = 11 mice per group; p = 0.0228 for first minute).
(H) Images from CA3a regions of shGFP (control, top) or shGPRI 58 (knockdown, bottom) animals injected in the DG after peripheral administration of OCN and pre-exposure-mediated contextual fear conditioning, stained for GFP (green) and OCN (red) (scale bar, 20 μm).
(I) Quantification of OCN protein accumulation in the CA3a region 7 days after the end of the behavioral task (unpaired t test, p = 0.0397; n = 6 mice per group). All data represent means ± SEM.